


- Kinetics and Synergistic Effects in the Pyrolysis Process of Hybrid Plastics and Product Analysis
Zhang Cangang*, **,†
 and Ma Xinglong*
*Dongying Vocational College of Science and Technology, No. 361, Yingbin Road, Guangrao County, Dongying City, Shandong Province, China, 257300, China
**City University Malaysia, Menara City U, No. 8, Jalan 51A/223
- 하이브리드 플라스틱 열분해 공정의 동역학 및 시너지 효과와 제품 분석
Reproduction, stored in a retrieval system, or transmitted in any form of any part of this publication is permitted only by written permission from the Polymer Society of Korea.
Pyrolysis technology serves as an effective method for the treatment of organic solid waste and yields substantial value. This study examines the pyrolysis characteristics, kinetic parameters, synergistic effects, and products derived from the pyrolysis of polystyrene (PS) and polyvinyl chloride (PVC) used as raw materials. The results demonstrate that the initial and final pyrolysis temperatures of mixed PS and PVC are significantly lower than those observed in the pyrolysis of either material alone. The kinetic analysis reveals that the average activation energy required for the mixed PS/PVC pyrolysis is greater than that for PS alone but less than that for PVC alone, indicating synergistic effects in the mixed pyrolysis process. These synergistic effects predominantly exert a positive impact. Additionally, the study of pyrolysis products shows that the rate of gas production in the mixed PS/PVC pyrolysis is markedly increased compared to individual pyrolysis processes, with the actual gas yield exceeding the theoretical yield by 7.90%. These results provide essential theoretical and empirical support for the industrial application of pyrolysis processes involving PS, PVC, and their mixtures.
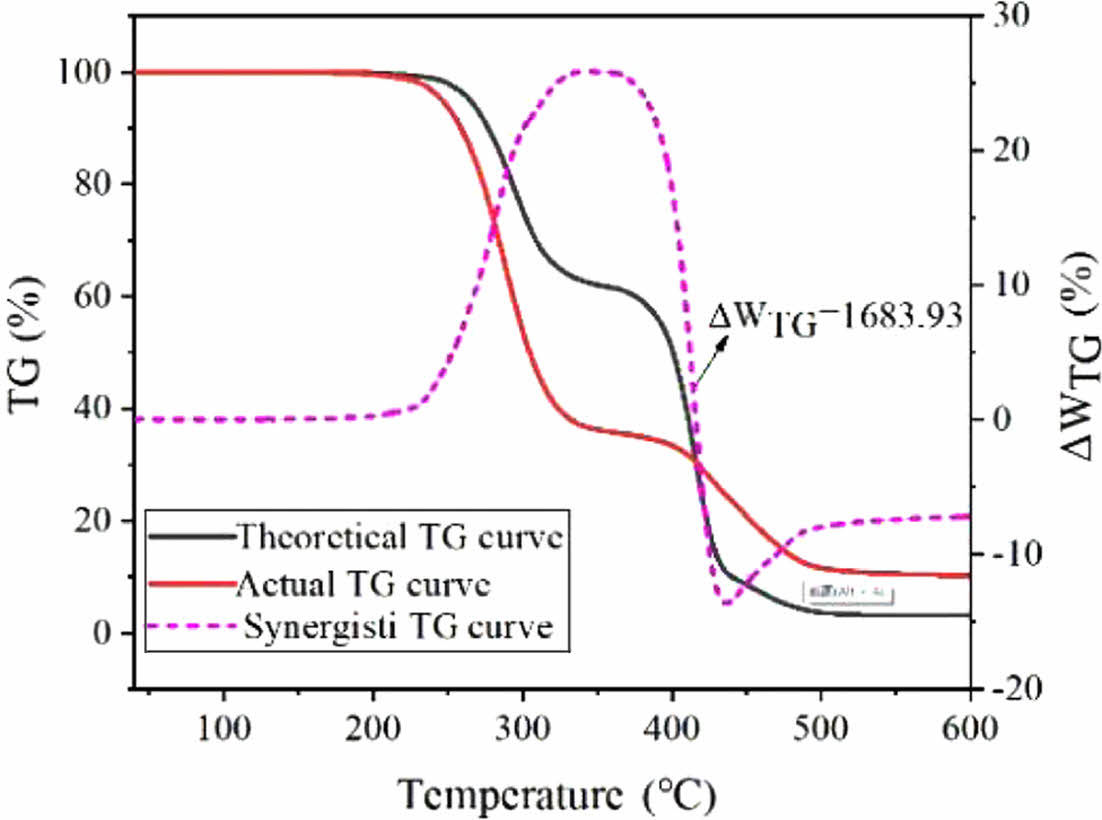
It can be seen from the polystyrene (PS)/WTs-theoretical thermogravimetric (TG) curve in the Figure that the synergistic effect in the pyrolysis process of PS/PVC is dominated by positive synergistic effect, and when the pyrolysis temperature of the experimental sample is 256.1-407.3 ℃, there is a positive synergistic interval (DWTG>0), indicating that there is a positive promotion effect on the co-pyrolysis of mixed samples in this stage. When the pyrolysis temperature is 407.7-600 ℃, there is a negative synergistic interval in the theoretical TG curve, indicating that there is a negative effect on the co-pyrolysis of mixed samples at this stage. However, the overall result of DWTG was >0, indicating that the whole pyrolysis process of PS/WTs mixture was mutually reinforcing.
Keywords: plastic, pyrolysis properties, dynamics, synergy, pyrolysis products.
The authors declare that there is no conflict of interest.
In contemporary society, plastic products are extensively employed across various sectors due to their low cost and resistance to impact and corrosion.1,2 Although the advent of plastic products has significantly enhanced daily convenience, the consequent escalation in environmental pollution is evident and poses considerable harm to both the natural and human environments.3Addressing the disposal and recycling of plastic products has become a critical issue, as it is integral to the effective utilization of limited energy resources.4-5
Recycling, incineration, and landfilling constitute the three primary methods traditionally employed for the management of waste plastics.6-8 However, not all waste plastics are recyclable; those that cannot be recycled are typically managed through landfilling or incineration. Incineration harnesses combustion to extract energy from waste plastics and recover their calorific value. Nonetheless, the efficiency of both combustion and heat energy recovery remains low. Additionally, the combustion process inevitably leads to equipment corrosion due to acid gases released from burning plastics. Moreover, the emission of toxic gases, such as dioxins, during combustion poses unpredictable risks to human organs. Given that waste plastics do not naturally decompose, landfilling results in extensive soil contamination and adversely affects terrestrial flora and the aquatic environment.9
Waste plastics exhibit fuel characteristics akin to petroleum; thus, pyrolysis facilitates the recovery of valuable pyrolysis oil and gas of considerable worth.10-12 Plastic pyrolysis, a method of chemical recycling, involves the thermochemical decomposition of the macromolecular long-chain structure of waste plastics into smaller molecular weight products such as high-value-added oils, combustible gases, and solid residues under controlled reaction conditions.13-15 These byproducts prove highly beneficial in the production and refining industries. The resultant liquid oil can be utilized directly as a fuel in furnaces, turbines, boilers, and diesel engines without necessitating further processing. Pyrolysis offers relatively flexible control over process variables and is regarded as environmentally benign since it does not contribute to water pollution. Furthermore, it enables the high yield recovery of liquid oil, positioning it as an optimal method for managing plastic waste.16 Overall, pyrolysis represents a sustainable and high-value recycling technique and stands as one of the foremost solutions for the resource management of waste plastics.17 Currently, the majority of researchers concentrate on the pyrolysis of single-component plastics, with less attention given to the pyrolysis of mixed plastics, particularly regarding the reduction of activation energy and the exploration of synergistic effects.18-20 This study specifically addresses the challenges of lowering the initial and final pyrolysis temperatures of mixed plastics, narrowing the pyrolysis temperature range, and reducing heating times through the co-pyrolysis of PS/PVC, thereby aiming to decrease energy consumption during pyrolysis. Additionally, it investigates the synergistic effects that facilitate the conversion of more pyrolysis oil into pyrolysis gas during the co-pyrolysis of PS/PVC.
Numerous studies have investigated the decomposition of waste plastics via pyrolysis. Sogancioglu et al.21 conducted experiments in a fixed-bed reactor to evaluate the effects of pyrolysis temperature and pre-treatment (washing) of waste plastics on product yields, specifically using polystyrene (PS) samples. The results demonstrated that at 700 ℃, unwashed PS yielded a liquid product of 67.12%, whereas washed PS yielded 55.20%. The residual charcoal from unwashed PS was 4.95%, in contrast to 8.56% from washed PS.21 The pyrolysis behaviors of various plastics including high-density polyethylene (HDPE), low-density polyethylene (LDPE), polyethylene terephthalate (PET), polypropylene (PP), and polystyrene (PS) were also studied by Sogancioglu et al.22 The findings indicated that HDPE produced the highest oil yield, while PET and PP yielded the lowest.22 Additionally, Miandad et al.23 investigated the impact of temperature on the yield and quality of liquid oil derived from PS pyrolysis. Their findings showed that the maximum oil yield of 80.8% was achieved at an optimal temperature of 450 ℃, with lower yields of gas (13%) and charcoal (6.2%).23 Supriyanto et al.24 investigated the rapid pyrolysis of LDPE, PP, and PS, identifying key reactions and gas yields for these polymers. In their analysis of the LDPE and PP pyrolysis process, it was determined that the mechanism predominantly involved random bond scission, leading to the formation of aliphatic compounds such as alkanes, alkenes, and alkanadienes. Conversely, PS pyrolysis primarily proceeded through fracture reactions that facilitated the production of styrene monomer. The materials were subjected to pyrolysis at 574 ± 22 ℃ for 5 seconds, yielding approximately 14 ± 1 wt%, 31 ± 3 wt%, and 103 ± 12 wt% for LDPE, PP, and PS, respectively.24 Miranda et al.25 conducted a detailed study on the pyrolysis of polyvinyl chloride (PVC), analyzing the reaction kinetics based on thermogravimetric (TG) analysis. The findings supported a three-stage reaction model for PVC pyrolysis: the first stage occurring from 200 to 320 ℃, the second from 250 to 375 ℃, and the third from 375 to 520 ℃. The activation energies for these stages were calculated as 198, 143, and 243 kJ/mol, respectively.25 Furthermore, Wu et al.26 explored the pyrolysis and co-pyrolysis behaviors of PE, PS, and PVC under an N2 atmosphere. Thermal gravimetric analysis (TGA) indicated that co-pyrolysis of PS and PVC exhibited a mutual inhibition effect, delaying the decomposition process.26 Yin et al.27 conducted a thermogravimetric analysis on mixed plastics (PP/PS/PVC) utilizing three distinct heating rates. Employing both model-free and model methods, they accurately determined the activation energy range necessary for the pyrolysis of these plastics. The study accounted for the complexity of the pyrolysis reactions in mixed plastics. The activation energy, as estimated by the model method, ranged from 116.1 to 119.2 kJ/mol, which closely matched the 113.4 to 116.7 kJ/mol range determined by the model-free method.27 Lu et al.28 transformed everyday PS into valuable chemicals through chemical recycling in an N2 atmosphere. Their research revealed that the liquid oil yield from pyrolyzed PS was as high as 76.24%, with the primary component identified as styrene via hydrogen nuclear magnetic resonance spectroscopy. They also delineated the reaction mechanism of the PS pyrolysis process.28 Li et al.29 explored the pyrolysis characteristics, kinetics, and product distribution of mixed waste plastics containing PS/PE/PVC. The analysis of thermogravimetric (TG) and derivative thermogravimetry (DTG) curves showed that the curves for PS and PE were similar, yet distinct from those of PVC. The pyrolysis products indicated that PE and PS predominantly yield alkanes and olefins, whereas PVC primarily generates hydrogen chloride, olefins, and a minor quantity of aromatic compounds.29
This investigation highlights that while numerous studies have been conducted on the pyrolysis of waste plastics, there remains a gap in research that comprehensively addresses the pyrolysis characteristics, kinetics, synergistic effects, and distribution of pyrolysis products. This article specifically focuses on the pyrolysis of PS and PVC, both individually and in combination (PVC/PS). The pyrolysis characteristics of the experimental samples were determined using a thermogravimetric analyzer (TGA), and kinetic parameters were estimated through various kinetic models including the Flynn-Wall-Ozawa (FWO) method, the Kissinger-Akahira-Sunose (KAS) method, and the Starink method. The synergistic effects in the PVC/PS pyrolysis process were assessed using both theoretical and actual TG-DTG curve methods. Additionally, the distribution of pyrolysis products across solid, liquid, and gas phases was explored through dedicated pyrolysis experiments.
Material and Methods. Experimental Samples: Common waste plastics encountered in daily life include polyethylene (PE), polypropylene (PP), polystyrene (PS), polyvinyl chloride (PVC), and polyethylene terephthalate (PET). In studies of mixed waste plastics, utilizing pure plastics as substitutes for waste plastics can enhance the reference value of experimental outcomes. For this experiment, plastic samples were sourced as pure plastic pellets from Sinopec Yanshan Branch. The PS and PVC samples were processed using a crusher (Model DH-PC180, Luoyang Dihai Machinery Co., Ltd.), followed by the grouping of the experimental samples. The results of the grouping are presented in Table 1.
Thermogravimetric Analysis: Thermogravimetric analysis (TGA) is a thermal technique that measures the mass of a sample as a function of temperature (℃) or time (t). This method, commonly conducted at a constant heating rate, is extensively utilized to investigate the pyrolysis characteristics and kinetics of solid organic wastes. In the current experiment, the same sample underwent thermogravimetric testing at three predetermined heating rates (10, 20, and 30 ℃/min). The temperature range for the pyrolysis was established from 40 to 700 ℃. High-purity nitrogen served dual roles as both the purge gas (40 mL/min) and the shielding gas (20 mL/min). An alumina crucible was employed for the experiment.
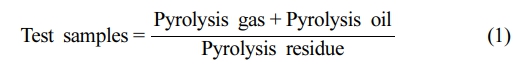
Dynamic Modeling: During the pyrolysis process, the test sample undergoes thermal decomposition, which results in the formation of gaseous, liquid, and solid products. The reaction process can be summarized as follows:
The characteristics of pyrolysis are influenced by both the temperature and the process conditions. By conducting a kinetic analysis, it is possible to determine the conversion rate (α) of the sample throughout the pyrolysis process.
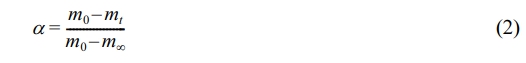
The weight percentage conversion rate is denoted as wt%. The initial mass of the sample, m0 (in mg), and the mass of the sample at temperature T, mt (in mg), are specified. The final residue mass is indicated as m∞.
The reaction rate, defined as dα/dt, is determined by the reaction rate constant, k(T), and the function f (α), which is related to the pyrolysis mechanism. The relationship between the reaction rate constant, k(T), and temperature T is described by the Arrhenius equation.
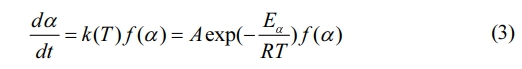
Let t represent the time, measured in minutes. The derivative of the function describing the pyrolysis mechanism is denoted by f (α). A represents the pre-exponential factor, with units of 1/min. Eα is the activation energy, measured in kJ/mol. R denotes the universal gas constant, which is equal to 8.314 J/mol·K.
The expression for the relation T and t in a non-isothermal relation is:
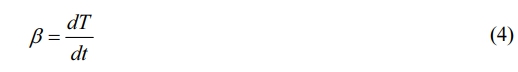
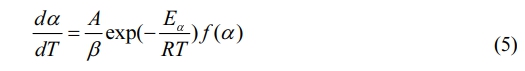
The heating rate, given in ℃/min, can be determined. Bringing Eq. (4) into Eq. (3), a broad expression of the non-isothermal, heterogeneous reaction of the test sample is obtained:
In this experiment, a combination of three model-free methods—the FWO, KAS, and Starink methods—was utilized to determine the kinetic activation energy. Employing multiple kinetic models to estimate the activation energy of the same sample minimizes the potential for relative error that might arise from using a single kinetic model. This approach enhances the reliability of the calculated results.
Model-Free Method: The equation for the FWO method is expressed as follows30:
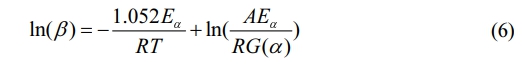
The integral expression of the pyrolysis mechanism function is denoted by G(α).
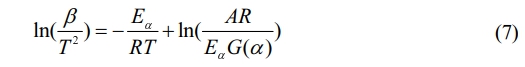
The equation for the KAS method is expressed as follows31:
Starink’s equation is expressed as follows32:
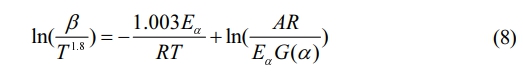
In the computation of Eqs. (6)-(8), the independent variable used is 1/T, where TTT is the temperature in Kelvin. The dependent variables for curve fitting are ln(β), ln(β/T 2), and ln(β/T 1.8) respectively. By analyzing the slope of these curves, we can estimate the activation energy (Eα) for various conversion rates.
Synergies: The synergistic effect allows us to identify intervals that either promote or inhibit the co-pyrolysis of mixed samples.32 This understanding aids in determining the combinations of samples that facilitate reduced energy consumption during co-pyrolysis. In this experiment, the theoretical TG-DTG curve method was employed to analyze these effects.
Theoretical TG Curve Method: The co-pyrolysis process utilizes the theoretical TG (thermogravimetric) method to detect the presence of synergistic effects. The formula used to derive the theoretical TG curve is detailed below33:
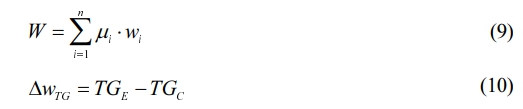
In Eq. (9), μi is the proportion of a single sample to the total mass, wt%; Wi is the TG curve of a single test sample; TGE and TGC are theoretical and practical TG curves, respectively. The DWTG sum represents the discrepancy between the hypothetical TG curve and the observed TG curve.
In Eq. (10), a value of ΔWTG less than zero (ΔWTG < 0) indicates an adverse interaction during the co-pyrolysis process of the test samples. Conversely, a ΔWTG greater than zero (ΔWTG > 0) signifies a positive synergy in the co-pyrolysis.
Pyrolysis Experiment : To investigate the yields of solid, liquid, and gas products from the pyrolysis of PS, PVC, and PS/PVC, experiments were conducted using pyrolysis reactors tailored to the specific traits of these materials. Initially, the mass of the quartz boat, quartz tube, oil and gas condensing device, and liquid oil collection device were determined using a precision scale. Subsequently, a 10 g sample was placed in the quartz boat, and the installation of sealing devices (including flanges and sealing rings), as well as the oil and gas condensing and liquid oil collection devices, was completed. The experiment commenced with the heating program, which gradually increased the temperature from room temperature to 600 ℃ at a rate of 10 ℃ per minute. Upon reaching 600 ℃, the system was allowed to cool to ambient temperature. The weights of the pyrolysis oil and residue were then precisely measured. The weight of the pyrolysis gas was calculated by subtracting the combined weight of the pyrolysis oil and residue from the initial total weight.

TG-DTG Curve Analysis. The TG-DTG curve effectively provides information on mass loss, pyrolysis rate, the presence of multiple pyrolysis peaks, and residual mass under varying heating rates. Figure 1 visually displays the TG-DTG curves for the individual pyrolysis of PS and PVC, as well as the co-pyrolysis of PS/PVC, conducted at heating rates of 10, 20, and 30 ℃/min.
Figure 1 illustrates that the TG-DTG curves for PS, PVC, and PS/PVC exhibit consistent patterns across various heating rates, including 10, 20, and 30 ℃/min. This consistency indicates that alterations in the heating rate do not affect the overall shape of the TG-DTG curves. However, it is observed that as the heating rate increases, the TG curves shift towards higher temperatures. This shift is primarily due to pyrolysis hysteresis in the experimental materials, which is influenced by the heating rate.34 The DTG curves distinctly show that the maximum rate of pyrolysis is significantly elevated at higher heating rates compared to lower ones. This trend suggests a direct correlation between the heating rate and the maximum rate of pyrolysis. The primary reason for this is that higher heating rates result in shorter exposure times to heat for the materials, thus increasing the maximum rate of pyrolysis. Therefore, it can be concluded that the maximum rate of pyrolysis escalates with an increase in the heating rate.
Pyrolysis Characteristic Analysis. Table 2 presents the pyrolysis properties of the experimental samples (PS, PVC, and PS/PVC) at heating rates of 10, 20, and 30 ℃/min. These properties provide deeper insights and a more detailed analysis of the TG-DTG curve, covering initial and final pyrolysis temperatures, temperatures at which maximum weight loss occurs, the highest rate of weight loss, and the residual mass for each sample.
Combined with Figure 1 and Table 2, the TG-DTG curve analysis, conducted at a heating rate of 10 ℃/min, offers insights into the pyrolysis processes of PS, PVC, and their combination. Figure 1(b) shows a single weight loss peak for PS, indicating that its pyrolysis occurs in a single stage. The temperature range for PS pyrolysis is 393.7-429.9 ℃, with the maximum weight loss occurring at 417.8 ℃ and a rate of 30.4%. In contrast, Figure 1(d) displays two distinct weight loss peaks for PVC, suggesting two separate pyrolysis stages. The first stage ranges from 265.7-333.2 ℃, peaking at 292.6 ℃ with a weight loss rate of 13.9%. This stage primarily involves dechlorination, leading to significant hydrogen chloride gas release.35 The second stage spans 427.0-486.6 ℃, with the peak weight loss at 455.2 ℃ and a rate of 2.9%, where the reaction involves breakdown of the polyene-conjugated structure, resulting in crosslinking, isomerization, and aromatization of the pyrolysis products.36 Figure 1(f) illustrates that the co-pyrolysis of PS and PVC also manifests in two stages. The first stage occurs within 256.1-330.2 ℃, peaking at 288.6 ℃ with a weight loss rate of 10.7%. The second stage ranges from 341.2-483.9 ℃, peaking at 425.3 ℃ with a rate of 3.1%. Notably, the residue mass from the mixed pyrolysis of PS and PVC exceeds the sum of the residues from individual pyrolyses, indicating interactive effects during co-pyrolysis. Moreover, a comparison of the initial and terminal pyrolysis temperatures between individual and mixed pyrolysis of PS and PVC reveals that the co-pyrolysis initiates and terminates at lower temperatures, and the chlorine release is accelerated. This suggests that adding PS might enhance heat transfer or provide additional free radicals necessary for the reaction, thereby facilitating the process.37
Analysis of Kinetic Parameters. Activation energy, often termed apparent activation energy, represents the minimum energy required to initiate a chemical reaction or to form a complex molecule. A lower activation energy suggests that the sample can achieve a higher reaction rate during the pyrolysis process with minimal external energy input.38 The activation energy for the sample at various conversion rates was calculated using the slope of the fitting curve. The conversion rate (α) was determined within the range of 0.1 to 0.9, with intervals of 0.1. Table 3 presents the range and average values of the kinetic parameters for PS, PVC, and PS/PVC across different kinetic models.
As indicated in Table 3, the kinetic parameters (Eα) for the test samples (PS, PVC, and PS/PVC) vary within a specific range, reflecting the differences in energy requirements for pyrolysis at different stages of the process.39 The average activation energy results obtained from the three kinetic models are consistent, which suggests that these calculations are reliable. The average activation energy values ranked from highest to lowest are PVC > PS/PVC > PS, indicating varying degrees of complexity and synergy in the reactions during the co-pyrolysis of PS and PVC.
When comparing the average activation energy (Av) for the Flynn-Wall-Ozawa (FWO) method detailed in Table 3, it is evident that the addition of PS substantially influences the activation energy required for the entire pyrolysis reaction of PVC. Initially, the activation energies for the first and second stages of PVC pyrolysis were 139.32 kJ/mol and 168.23 kJ/mol, respectively, with an overall activation energy of 307.55 kJ/mol. Upon adding PS, these values decreased significantly for the PS/PVC mixture: the first stage showed an average activation energy of 95.76 kJ/mol, the second stage was 138.39 kJ/mol, and the overall pyrolysis stage was 234.15 kJ/mol. This value is notably lower than the theoretical average activation energy of 251.83 kJ/mol calculated for the PS/PVC mixture. The primary factor contributing to this reduction is the extensive branching in PS, which effectively lowers the energy required for chain scission in the PS/PVC mixture. Consequently, the overall activation energy for the PS/PVC mixture is reduced, indicating that incorporating PS into the PVC mixture is beneficial in terms of reducing energy consumption. These results are consistent with the findings on the pyrolysis characteristics of the mixture.
Synergy Analysis. Synergy is a key criterion for assessing the energy consumption of mixed experimental samples during the pyrolysis process. The theoretical TG-DTG curve allows observation of the synergistic strength and synergistic interval of PS and WTs during mixed pyrolysis. At a heating rate of 10 ℃/min, the theoretical TG-DTG curve for PS/PVC co-pyrolysis is depicted in Figure 2.
The theoretical TG curve for the PS/WTs mixture, as shown in Figure 2, indicates that the synergetic effects in the pyrolysis process of PS/PVC are predominantly positive. Within the temperature range of 256.1 to 407.3 ℃, there is a positive syn- ergetic interval (ΔWTG > 0), suggesting a beneficial influence on the co-pyrolysis of the mixed samples during this phase. In contrast, between temperatures of 407.7 and 600 ℃, the the- oretical TG curve exhibits a negative synergetic interval, reflect-ing an adverse impact on the co-pyrolysis of the mixed samples in this stage. Nonetheless, the overall result for ΔWTG is greater than 0, indicating that the entire pyrolysis process for the PS/WTs mixture is synergistically enhanced.
Analysis of Pyrolysis Products. The proportion of solid-liquid-gas formed after pyrolysis of WTs is shown in Table 4.
An examination of Table 4 reveals the distribution of products from the pyrolysis of PS and PVC, both individually and in combination, across the temperature range from room temperature to 600 ℃. Specifically, the conversion of PS into pyrolysis oil, residue, and gas yields 89.20%, 10.60%, and 0.20%, respectively. For PVC, these figures are 19.30% for pyrolysis oil, 6.20% for residue, and 74.50% for pyrolysis gas. In the case of co-pyrolysis of PS and PVC, the yields are 50.00% for pyrolysis oil, 9.70% for residue, and 40.30% for pyrolysis gas. Comparatively, the theoretical calculations for co-pyrolysis predict yields of 54.25% for pyrolysis oil, 8.40% for residue, and 37.35% for pyrolysis gas. Notably, the actual pyrolysis gas yield from the co-pyrolysis of PS and PVC significantly exceeds the theoretical predictions, underscoring enhanced synergistic effects.

|
Figure 1 TG-DTG curves of PS, PVC, and PS/PVC: (a) TG curves of PS; (b) DTG curves of PS; (c) TG curves of PVC; (d) DTG curves of PVC; (e) TG curves of PS/PVC; (f) DTG curves of PS/PVC |

|
Figure 2 Theoretical TG curves of PS/PVC. |
|
Table 2 Pyrolysis Characteristics of PS, PVC, and PS/PVC |

Note: Ts, Tm, Tf, and S are the initial pyrolysis temperature, the maximum weight loss temperature, the termination pyrolysis temperature and the maximum weight loss rate, respectively. |

|
Table 4 The Composition Ratio of Pyrolysis Products from WTs (Solid-Liquid-Gas) |

In this paper, we present a comprehensive analysis of the pyrolysis of PS and PVC, both individually and in combination, using thermogravimetric analysis (TGA). We explored the pyrolysis characteristics, kinetics, synergistic effects, and the distribution of pyrolysis products (solid, liquid, gas). The study yielded the following conclusions:
(1) Thermogravimetric analysis demonstrated that the mixture of PS and PVC had a significantly lower initial pyrolysis temperature (256.1 ℃) and termination temperature (483.9 ℃) at a heating rate of 10 ℃/min, compared to the separate pyrolysis of PS and PVC. Additionally, PVC alone exhibited a lower initial pyrolysis temperature (265.7 ℃) and termination temperature (486.6 ℃) than when pyrolyzed individually.
(2) Using the Flynn-Wall-Ozawa (FWO) model-free method, the actual average activation energy (234.15 kJ/mol) during the co-pyrolysis of the PS/PVC mixture was found to be significantly lower than the calculated average activation energy (251.83 kJ/mol). This indicates a synergistic effect during the co-pyrolysis process.
(3) In the temperature range of 256.1 to 407.3 ℃, there is a positive synergistic time interval (¥ÄWTG > 0), indicating that this stage has a favorable effect on the co-pyrolysis of the mixed sample. In contrast, between 407.7 and 600 ℃, the theoretical TG curve shows a negative synergistic interval, reflecting the unfavorable effect of this stage on the co-pyrolysis of the mixed sample. Nevertheless, the overall result of ¥ÄWTG is greater than 0, the promotion effect is greater than the inhibition effect, and the PS/WTs mixture is synergistically enhanced throughout the pyrolysis process.
(4) Pyrolysis experiments conducted on three sample types (PS, PVC, and PS/PVC) using pyrolysis reactor equipment revealed that the co-pyrolysis process leads to a higher conversion of pyrolysis oil into pyrolysis gas.
- 1. Al-Salem, S. M.; Antelava, A.; Constantinou, A.; Manos, G.; Dutta, A. A Review on Thermal and Catalytic Pyrolysis of Plastic Solid Waste (PSW). J. Environ. Manag. 2017, 197, 177-198.
-

- 2. Gopinath, K. P.; Nagarajan, V. M.; Krishnan, A.; Malolan, R. A Critical Review on the Influence of Energy, Environmental and Economic Factors on Various Processes Used to Handle and Recycle Plastic Wastes: Development of a Comprehensive Index. J. Clean. Prod. 2020, 274, 123031.
-
- 3. Armenise, S.; Syieluing, W.; Ramírez-Velásquez, J. M.; Launay, F.; Muoz, M. Plastic Waste Recycling via Pyrolysis: A Bibliometric Survey and Literature Review. J. Anal. Appl. Pyrolysis2021, 158, 105265.
-
- 4. Kumar, S.; Panda, A. K.; Singh, R. K. A Review on Tertiary Recycling of High-density Polyethylene to Fuel. Resour. Conserv. Recycl. 2011, 55, 893-910.
-
- 5. Kang, H. K.; Yu, M. J.; Park, S. H.; Jeon, J. K.; Kim, S. C.; Park, Y. K. Catalytic Pyrolysis of Miscanthus and Random Polypropylene over SAPO-11. Polym. Korea 2013, 37, 379-386.
-
- 6. Aznar, M. P.; Caballero, M. A.; Sancho, J. A.; Francés, E. Plastic Waste Elimination by co-gasification with Coal and Biomass in Fluidized Bed with Air in Pilot Plant. Fuel Process. Technol. 2006, 87, 409-420.
-
- 7. Saikrishnan, S.; Jubinville, D.; Tzoganakis, C.; Tizazu, H. Thermo-mechanical Degradation of Polypropylene (PP) and Low-density Polyethylene (LDPE) Blends Exposed to Simulated Recycling. Polym. Degrad. Stab. 2020, 182, 109390.
-
- 8. Sharuddin, S.; Abnisa, F.; Daud, W.; Aroua, M. A Review on Pyrolysis of Plastic Wastes. Energy Convers. Manag. 2016, 115, 308-326.
-
- 9. Sharuddin, S.; Abnisa, F.; Daud, W.; Aroua, M. Production, Characterization and Fuel Properties of Alternative Diesel Fuel From Pyrolysis of Waste Plastic Grocery Bags. Fuel Process. Technol.2014, 122, 79-90.
-
- 10. Passamonti, F. J.; Sedran, U. Recycling of Waste Plastics Into Fuels. LDPE Conversion in FCC. Appl. Catal. B: Environ. 2012, 125, 499-506.
-
- 11. Bridgwater, A. V. Review of Fast Pyrolysis of Biomass and Product Upgrading. Biomass Bioenergy 2012, 38, 68-94.
-
- 12. Senthil, K. P.; Bharathikumar, M.; Prabhakara, C.; Vijayan, S.; Ramakrishnan, K. Conversion of Waste Plastics Into Low-emissive Hydrocarbon Fuels Through Catalytic Depolymerization in a New Laboratory Scale Batch Reactor. Int. J. Energy Envir. Eng. 2017, 8, 167-173.
-
- 13. Nanda, S.; Berruti, F. Thermochemical Conversion of Plastic Waste to Fuels: A Review. Environ. Chem. Lett. 2021, 19, 123-148.
-
- 14. Kumar, A.; Sharma, M. P. GHG Emission and Carbon Sequestration Potential from MSW of Indianmetro Cities. Urban Climate 2014, 8, 30-41.
-
- 15. Brebu, M.; Bhaskar, T.; Murai, K.; Muto, K.; Sakata, Y.; Uddin, M. A. Thermal Degradation of PE and PS Mixed with ABS-Br and Debromination of Pyrolysis Oil by Fe and Ca-based Catalysts. Polym. Deg. Stab. 2004, 84, 459-467.
-
- 16. Lee, D. H.; Choi, H. J.; Kim, D. S.; Lee, B. H. Distribution Characteristics of Pyrolysis Products of Polyethylene. Polym. Korea 2008, 32, 157-162.
- 17. Dogu, O.; Pelucchi, M.; de Vijver, R. V.; Lee, D. H.; Choi, H. J.; Kim, D. S. The Chemistry of Chemical Recycling of Solid Plastic Waste via Pyrolysis and Gasification: State-of-the-art, Challenges, and Future Directions. Prog. Energ. Combust. Sci. 2021, 84, 1-59.
-
- 18. Pan, D.; Su, F.; Liu, C.; Guo, Z. Research Progress for Plastic Waste Management and Manufacture of Value-added Products. Ad. Compos. Hybrid Mater.2020, 3, 443-461.
-
- 19. Xayachak, T.; Haque, N.; Parthasarathy, R. King, S.; Emami, N.; Lau, D.; Pramanik, B. K. Pyrolysis for Plastic Waste Management: An Engineering Perspective. J. Environ. Chem. Eng.2022, 10, 108865.
-
- 20. Huang, S.; Wang, H.; Ahmad, W.; Ahmad, A.; Vatin, N. I.; Mohamed, A. M.; Deifalla, A. F.; Mehmood, I. Plastic Waste Management Strategies and Their Environmental Aspects: A Scientometric Analysis and Comprehensive Review. Int. J. Environmental Res. Public Health 2022, 19, 4556.
-
- 21. Sogancioglu, M.; Yel, E.; Ahmetli, G. Investigation of the Effect of Polystyrene (PS) Waste Washing Process and Pyrolysis Temperature on (PS) Pyrolysis Product Quality. Energy Procedia 2017, 118, 189-194.
-
- 22. Sogancioglu, M.; Ahmetli, G.; Yel, E. A Comparative Study on Waste Plastics Pyrolysis Liquid Products Ouantity and Energy Recovery Potential. Energy Procedia 2017, 118, 221-226.
-
- 23. Miandad, R.; Barakat, M. A.; Aburiazaiza, A. S.; Rehan, M.; Ismail, I. M. I.; Nizami, A. S. Effect of Plasticwaste Types on Pyrolysis Liquid Oil. Int. Biodeter. Biodegr. 2017, 119, 239-252.
-
- 24. Supriyanto, Paivi Ylitervo, Tobias Richards. Gaseous Productsfrom Primary Reactions of Fast Plastic Pyrolysis. J. Anal. Appl. Pyrol. 2021, 158, 10528.
-
- 25. Miranda, R.; Yang, J.; Roy, C.; Vasile, C. Vacuum Pyrolysis of PVC I. Kinetic Study. Polym. Degrad. Stab. 1999, 64, 127-144.
-
- 26. Wu, J.; Chen, T.; Luo, X.; Han, D.; Wang, Z.; Wu, J. TG/FTIR Analysis on Co-pyrolysis Behaviorof PE, PVC and PS. Waste Manag.2014, 34, 676-682.
-
- 27. Yin, F.; Zhuang, Q.; Chang, T.; Zhang, C.; Sun, H.; Sun, Q.; Wang, C.; Li, L. Study on Pyrolysis Characteristics and Kinetics of Mixed Plastic Waste. J. Mater. Cycles Waste Manag.2021, 23, 1984-1994.
-
- 28. Lu, C.; Xiao, H., Chen, X. Simple Pyrolysis of Polystyrene Into Valuable Chemicals. e-Polymers 2021, 21, 428-432.
-
- 29. Li, D.; Lei, S.; Wang, P.; Zhong, L.; Ma, W.; Chen, G. Study on the Pyrolysis Behaviors of Mixed Waste Plastics. Renew. Energ.2021, 173, 662-674.
-
- 30. Yao, Z.; Yu, S.; Su, W.; Wu,W.; Tang, J.; Qi, W. Kinetic Studies on the Pyrolysis of Plastic Waste Using a Combination of Model-fitting and Model-free Methods. Waste Manage. Res.2020, 38, 1-129.
-
- 31. Nisar, J.; Ali, G.; Shah, A.; Farooqi, Z. H.; Khan, R. A.; Iqbal, M.; Gul, M. Pyrolysis of Waste Tire Rubber: A Comparative Kinetic Study Using Different Models. Energ. Source. Part A. 2020, 42, 1-8.
-
- 32. Shan, T.; Bian, H.; Wang, K.; Li, Z.; Qiu, J.; Zhu, D.; Wang, C.; Tian, X. Study on Pyrolysis Characteristics and Kinetics of Mixed Waste Plastics Under Different Atmospheres. Thermochim. Acta. 2023, 722, 179467.
-
- 33. Kai, X.; Yangb, T.; Shena, S.; Li, R. TG-FTIR-MS Study of Synergistic Effects During co-pyrolysis of Corn Stalk and High-density Polyethylene (HDPE). Energ. Convers. Manage.2019, 181, 202-213.
-
- 34. Xu, F.; Wang, B.; Yang, D.; Hao, J.; Qiao, Y.; Tian, Y. Thermal Degradation of Typical Plastics Under High Heating Rate Conditions by TG-FTIR: Pyrolysis Behaviors and Kinetic Analysis. Energy Convers. Manag.2018, 171, 1106-1115.
-
- 35. Tondl, G.; Bonell, L.; Pfeifer, C. Thermogravimetric Analysis and Kinetic Study of Marine Plastic Litter. Mar. Pollut. Bull.2018, 133, 472-477.
-
- 36. Williams, P. T.; Slaney, E. J. Analysis of Products From the Pyrolysis and Liquefaction of Single Plastics and Waste Plastic Mixtures. Resour. Conserv. Recycl. 2007, 51, 754-769.
-
- 37. Liu, S.; Yu, J.; Bikane, K.; Chen, T.; Ma, C.; Wang, B.; Sun, L. Rubber Pyrolysis: Kinetic Modeling and Vulcanization Effects. Energy 2018, 155, 215-225.
-
- 38. Shahid, A.; Ishfaq, M.; Ahmad, M. S.; Farooq, M.; Hui, Z.; Batawi, A. H.; Shafi, M. E.; Aloqbi, A. A.; Gull, M.; Mehmood, M. A. Bioenergy Potential of the Residual Microalgal Biomass Produced in City Wastewater Assessed Through Pyrolysis, Kinetics and Thermodynamics Study to Design Algal Biorefinery. Bioresour. Technol. 2019, 289, 121701.
-
- 39. Hadigheh, S. A.; Wei, Y.; Kashi, S. Optimisation of CFRP Composite Recycling Process Based on Energy Consumption, Kinetic Behaviour and Thermal Degradation Mechanism of Recycled Carbon Fibre. J. Clean. Prod. 2021, 292, 125994.
-
- Polymer(Korea) 폴리머
- Frequency : Bimonthly(odd)
ISSN 0379-153X(Print)
ISSN 2234-8077(Online)
Abbr. Polym. Korea - 2023 Impact Factor : 0.4
- Indexed in SCIE
 This Article
-
2024; 48(5): 494-502
Published online Sep 25, 2024
- 10.7317/pk.2024.48.5.494
- Received on Mar 12, 2024
- Revised on Jun 20, 2024
- Accepted on Jun 20, 2024
Services
- Full Text PDF
- Abstract
- ToC
- Conflict of Interest
Introduction
Experimental
Results and Discussion
Conclusions
- References
Shared
Correspondence to
- Zhang Cangang
-
*Dongying Vocational College of Science and Technology, No. 361, Yingbin Road, Guangrao County, Dongying City, Shandong Province, China, 257300, China
**City University Malaysia, Menara City U, No. 8, Jalan 51A/223 - E-mail: 291181353@qq.com
- ORCID:
0009-0006-4776-6494
Hyecheon Building(Room 601), #354, Gangnam-Daero, Gangnam-Gu, Seoul 06242, Korea
TEL : 82-2-568-3860, 561-5203, 569-3860 FAX : 82-2553-6938 E-mail: polymer@polymer.or.kr