


- Polymer-based Sustained Release Tablets of Vitamin C Using Hydroxypropyl Methylcellulose and Ethylcellulose and Their Dissolution Tolerances
Hyeon Kyun Kim# , Gi Hyeong Sin# , Yoon Tae Goo, Chang Hyun Kim, Suk Hyung Kwon*, Jae Chul Jung*, and Young Wook Choi†

College of Pharmacy, Chung-Ang University, 84 Heuksuk-ro, Dongjak-gu, Seoul 06974, Korea
*Novarex Co., Ltd., Osong-eup, Heungdeok-gu, Cheongju-si, Chungbuk-do, Korea- 히드록시프로필 메틸셀룰로오스와 에틸셀룰로오스를 이용한 고분자 기반 서방형 비타민 C 정제 설계 및 용출 규격 설정
김현균# ·신기형# ·구윤태 ·김창현 ·권석형* ·정재철* ·최영욱†
중앙대학교 약학대학, *주식회사 노바렉스
Reproduction, stored in a retrieval system, or transmitted in any form of any part of this publication is permitted only by written permission from the Polymer Society of Korea.
In this study, we developed sustained release tablets of vitamin C (ascorbic acid, AA) to establish dissolution tolerances and recommend appropriate formulations. We fabricated hydroxypropyl methylcellulose (HPMC) matrix tablets (HTs) and ethylcellulose (EC)-pelletized tablets (ETs) using direct compression and/or fluidized coating. Along with three commercially available products for reference, we acquired the AA dissolution profiles of the prepared samples in 5% metaphosphoric acid aqueous solution to prevent the degradation of AA. We then compared the release patterns using the similarity factor (f2). The selected two formulations (HT7 and ET1) showed drug release within the limit of ±15% of the reference curve, followed by the Korsmeyer-Peppas model. We found that the range of dissolution tolerance for the sustained release formulation was 15-40% (1 h), 25-70% (3 h), 50-90% (5 h), and ≥80% (8 h).
본 연구에서는 서방형 비타민 C의 용출 규격 설정과 적절한 제형을 추천하기 위하여 서방형 비타민 C 정제를 개발하였다. 직타법을 이용한 히드록시프로필 메틸셀룰로오스 정제(HTs)와 에틸셀룰로오스로 유동층 코팅된 과립을 타정한 정제(ETs)가 제조되었다. 시판 제품 3종을 대상으로 비타민 C의 분해를 방지하기 위해 5% 메타인산 수용액 조건하에 수행된 비타민 C 용출 양상을 확보하였다. 해당 용출 양상을 기준선으로 하여, 유사성 인자(f2)를 통해 여러 제형의 비타민 C 용출 양상을 비교하였다. 최종 선택된 제형(HT7과 ET1)은 Korsmeyer-Peppas 모델에 근거한 약물 방출 메커니즘을 따르며, 이들의 용출 양상은 기준선 대비 ±15% 이내의 범위에 분포함을 확인하였다. 결과적으로 서방형 비타민 C에 대한 용출 규격은 15-40%(1시간), 25-70%(3시간), 50-90%(5시간), 그리고 80% 이상(8시간)의 용출범위 내에서 설정되었다.
Sustained release formulations of vitamin C were developed by using hydroxypropyl methylcellulose (HPMC) and ethylcellulose (EC). The dissolution tolerance was suggested based on the dissolution profile of commercially available products. HPMC matrix tablet (HT7) and EC-pelletized tablet (ET1) were recommended for sustained release formulations of vitamin C.
Keywords: vitamine C, hydroxypropyl methylcellulose, ethylcellulose, matrix tablet, dissolution tolerance.
This work was supported by a Chung-Ang University Research Scholarship Grant in 2021. We would also like to thank Novarex Co., Ltd. for the financial support and for supplying the materials.
The authors declare that there is no conflict of interest.
Vitamin C (ascorbic acid, AA) is an essential nutrient for humans and several other species.1 It helps recovery from fatigue and prevents scurvy by acting as an antioxidant.1,2 The oral daily dose of AA varies, though it is generally recommended as 200-1000 mg per day.3 However, the oral bioavailability of AA depends on its dose because it primarily gets absorbed from the small intestine via sodium-dependent transport.4 Therefore, despite a high dose (~1000 mg) of AA, the oral absorption could be insufficient, and a sustained release formulation needs to be developed.5-7
Oral sustained release formulations have been developed using diverse techniques such as polymer membrane encapsulation, polymer matrix dispersion, osmosis, hydration, and hydrolysis activation.8 Among these methods, dispersing drugs in an inert polymeric matrix is the simplest way to facilitate the controlled release of drugs. In polymeric systems, the active agent is physically blended with the polymer bed and then fused into the tablet dosage form by compression, which is a common process in the pharmaceutical industry. Sustained release formulations are designed to deliver an active agent into the gastrointestinal (GI) tract for absorption, thus maintaining a therapeutic concentration in the systemic circulation for an extended period of time.9
The selection of proper polymers is a key step for developing those sustained formulations.10 Different types of polymers including water-soluble polymers (amylose, amylopectin, and hydroxypropyl methylcellulose [HPMC]) and water-insoluble polymers (ethylcellulose [EC], polymethacrylate, and glyceryl behenate) are available.10,11 Among them, HPMC and EC is the most widely used for preparing matrix-type and/or membrane-type controlled release formulations.11-13 HPMC, a cellulose ether derivative, has a sophisticated drug release mechanism-its micro/macro structure strongly changes with time upon exposure to water. It absorbs the GI fluid, swells, and forms a gel structure.14 The higher the viscosity, the higher is the strength of the gel.15 This property makes it easy to adjust water infiltration into the matrix, thus controlling the dissolution rate of active components.14,15 EC has been widely used as a film coating agent as it is non-toxic, non-irritating, and non-allergenic.16 As EC is insoluble in the GI tract, EC-coated pellets with different coating thicknesses have different drug release behaviors.17
Although numerous AA-containing sustained release tablets have been developed and introduced in the market, standardized protocols for drug release, including dissolution tolerance, are not fully available. Considering the oxidative instability of AA in aqueous solutions, the addition of an oxidizing inhibitor such as metaphosphoric acid in the dissolution medium is required.18 For the determination of AA, either ultraviolet (UV) spectrophotometric assay or high-performance liquid chromatographic assay is recommended.7,19 However, time-course AA release profiles with dissolution tolerance have not yet been suggested. The similarity factor (f2) is typically applied for estimating the similarity between in vitro dissolution profiles according to several FDA and EMEA guidelines.20 Moreover, based on the mathematical model, the estimation of release kinetics provides information on drug release mechanisms, thereby suggesting requirements for proper polymeric systems.21
Therefore, in the present study, to develop an appropriate oral sustained release formulation of AA, we prepared various tablets using different types of HPMC and/or EC, varying their viscosity and amount. Further, to suggest a criterion for dissolution tolerances, we compared their drug release characteristics with those of the reference product. We also applied mathematical approaches for the analysis of similarity factors and release kinetics.
Materials. AA powder was supplied by Novarex Co., Ltd. (Cheongju-si, Chungbuk-do, Korea). We purchased AA granules from Dongjin Pharma. Co. (Seocho-gu, Seoul, Korea) and sustained release-type reference tablets containing 1000 mg of AA from NOW Foods (Bloomingdale, IL, USA), Solaray (Park City, UT, USA), and Nature’s Truth (Ronkonkoma, NY, USA). HPMC and EC were supplied by Shin-Etsu Chemical Co. (Chiyoda-ku, Tokyo, Japan). Triethyl citrate (TEC), talc, and fermented spirits were kindly gifted by CTC Bio (Hawsung-si, Gyeonggi-do, Korea). Silicified microcrystalline cellulose (SMCC90) was provided by Novarex Co., Ltd. (Cheongju-si, Chungbuk-do, Korea). Aerosil 200 was supplied by Evonik Degussa GmbH (Frankfurt am Main, Germany). We purchased magnesium stearate from Samchun Pure Chemical Co. (Pyongtaek-si, Gyeonggi-do, Korea), glyceryl behenate from Masung & Co. (Seocho-gu, Seoul, Korea), and metaphosphoric acid from Duksan Pure Chemicals Co. (Ansan-si, Gyeonggi-do, Korea).
Preparation of HPMC Matrix Tablets (HTs). We prepared various HTs by either dry granulation or direct compression while varying the viscosity and the amount of HPMC. The procedure is depicted in Scheme 1.
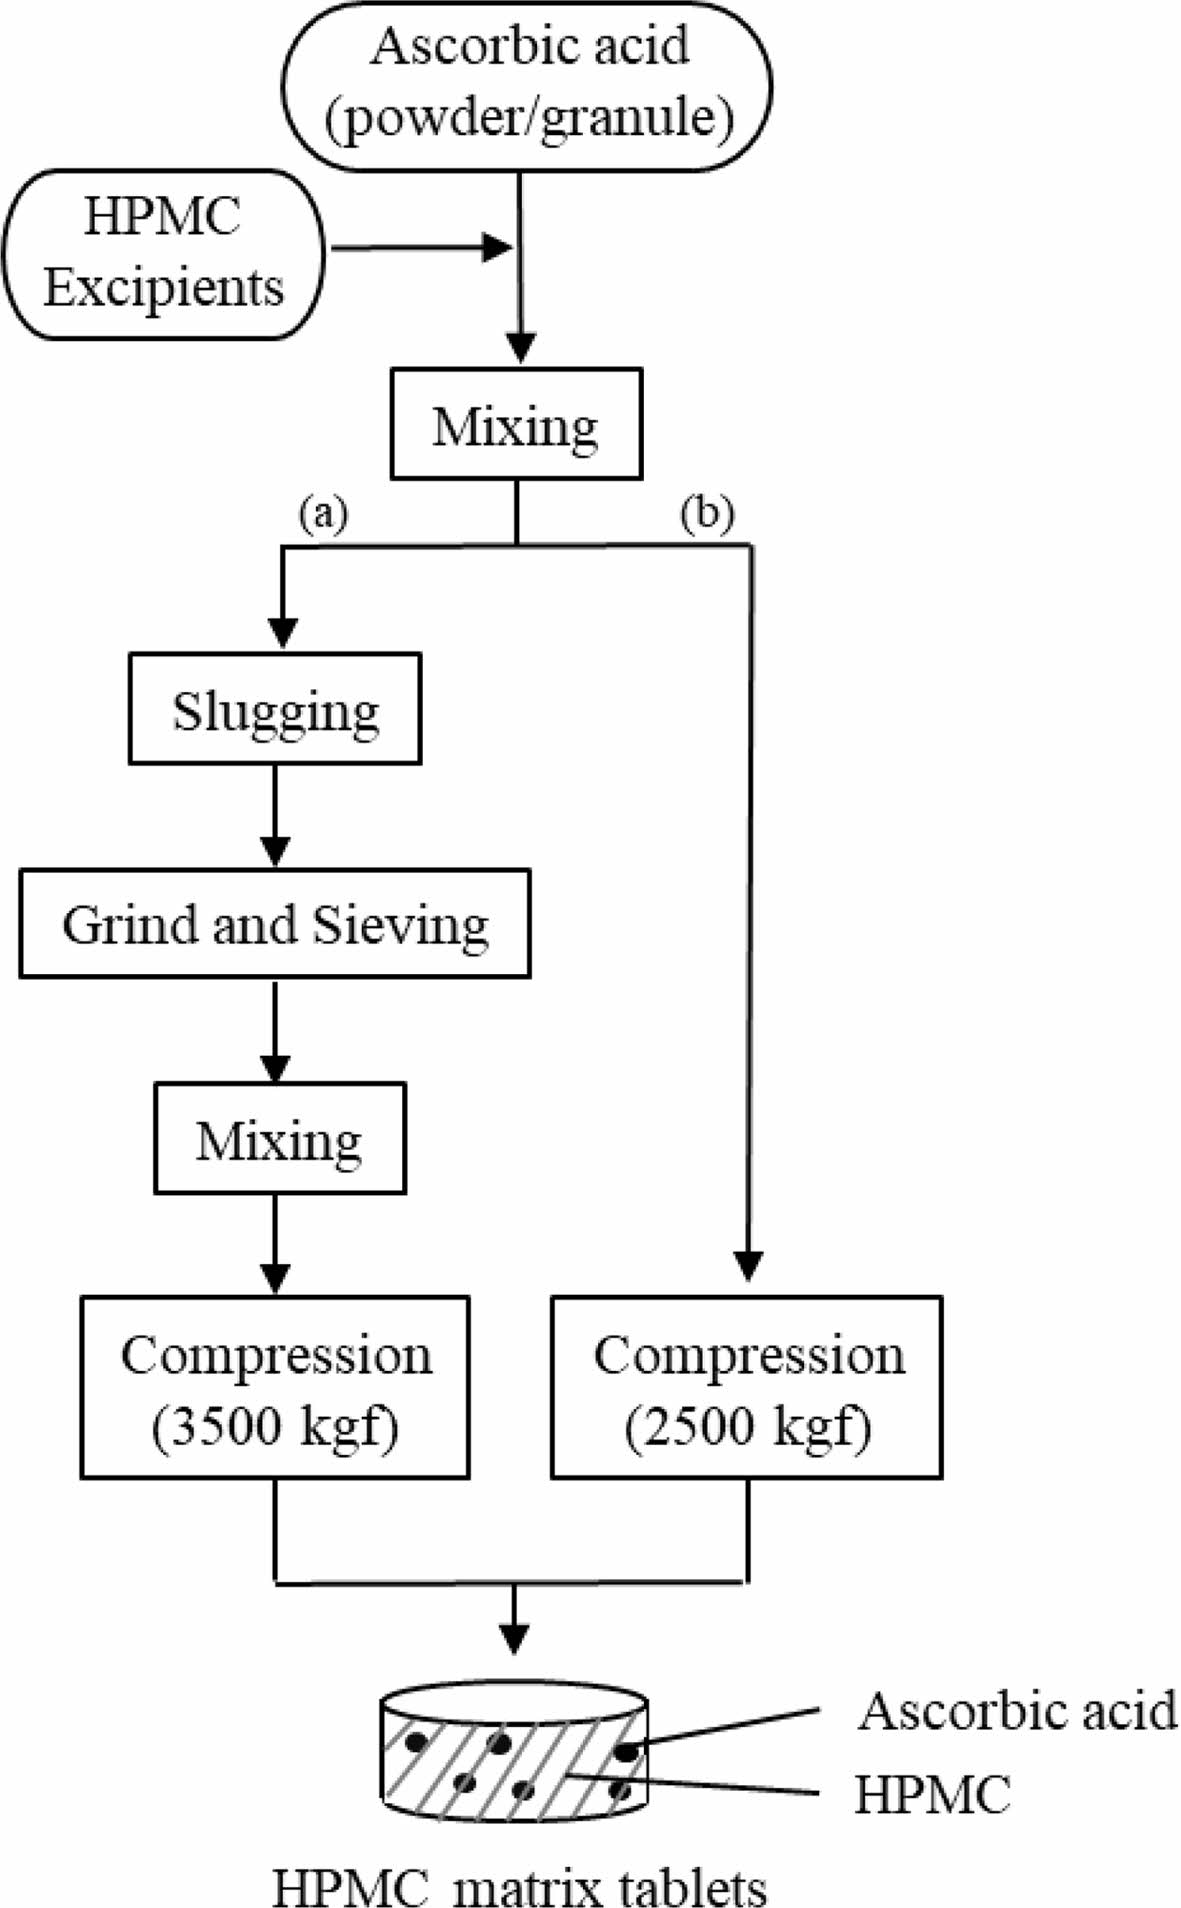
Scheme 1. Flow chart for the manufacture of HPMC matrix tablets. (a) and (b) denote the dry granulation and direct compression methods, respectively
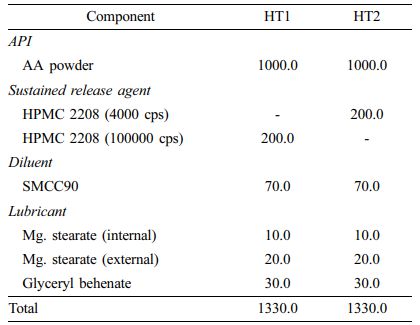
Dry Granulation Method: Prior to tablet compression, we prepared AA-containing dry granules by slugging and milling. Briefly, we homogeneously mixed AA powder with HPMC 2208, SMCC90 (diluent), magnesium stearate (lubricant), and glyceryl behenate (lubricant) and slugged the mixture using a single-punch tablet press (HANDTAB-200, Ichihashi-Seiki Co. Ltd., Kyoto, Japan; compression force of 2500 kgf/punch). The slugs were milled and granulated using co-mil (mesh type: 1016 nm). We added extra magnesium stearate to the dry granules and then compressed the mixture using the single-punch tablet press (compression force of 3500 kgf/punch; rectangle with a major axis of 20 mm and a minor axis of 10 mm). The final compositions of the dry granulated tablets (HT1 and HT2) are listed in Table 1.
Direct Compression Method: For direct compression, instead of AA powder, we used AA granules (3 w/w% HPMC coated) with good flowability. The compositions of directly compressed tablets (HT3-HT9) are listed in Table 2. We homogeneously mixed all components, then tableted them using a single-punch tablet press (compression force of 2500 kgf/punch; rectangle with a major axis of 20 mm and a minor axis of 10 mm).
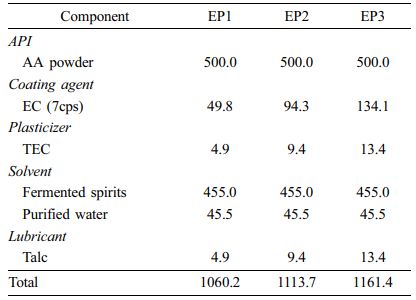
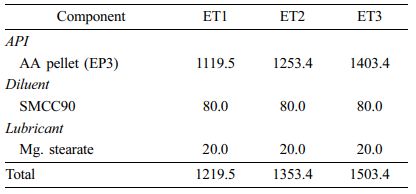
Preparation of EC Pellets (EPs) and EC Pelletized Tablets (ETs). We prepared EC-coated formulations in the form of pellets (EP1-EP3) and tablets (ET1-ET3) and varied the amount of EC. The procedure is depicted in Scheme 2. We prepared the coating solution by dissolving EC, talc (lubricant), and TEC (plasticizer) in fermented spirits and then adding purified water. We passed the AA powder through a 20-mesh sieve and placed it in the fluid-bed coater (GX-20, Freund, Japan), which we then preheated to 30 ℃. Centrifugal coating was performed with the following processing conditions: inlet temperature 50 ℃, product temperature 28-32 ℃, and exhaust air temperature 30-35 ℃; inlet air flow 0.15 L/min; spray air pressure 0.2 mPa; rotor speed 200 rpm; and pump flow 5-6 g/min. We passed the coated pellets through an 18-mesh sieve to obtain EPs. To obtain ETs, we mixed AA pellets with SMCC90 (diluent) and magnesium stearate (lubricant) and then tableted them using a single-punch tablet press (compression force of 2500 kgf; rectangle with a major axis of 20 mm and a minor axis of 10 mm). The final compositions of EPs and ETs are listed in Table 3 and 4, respectively.
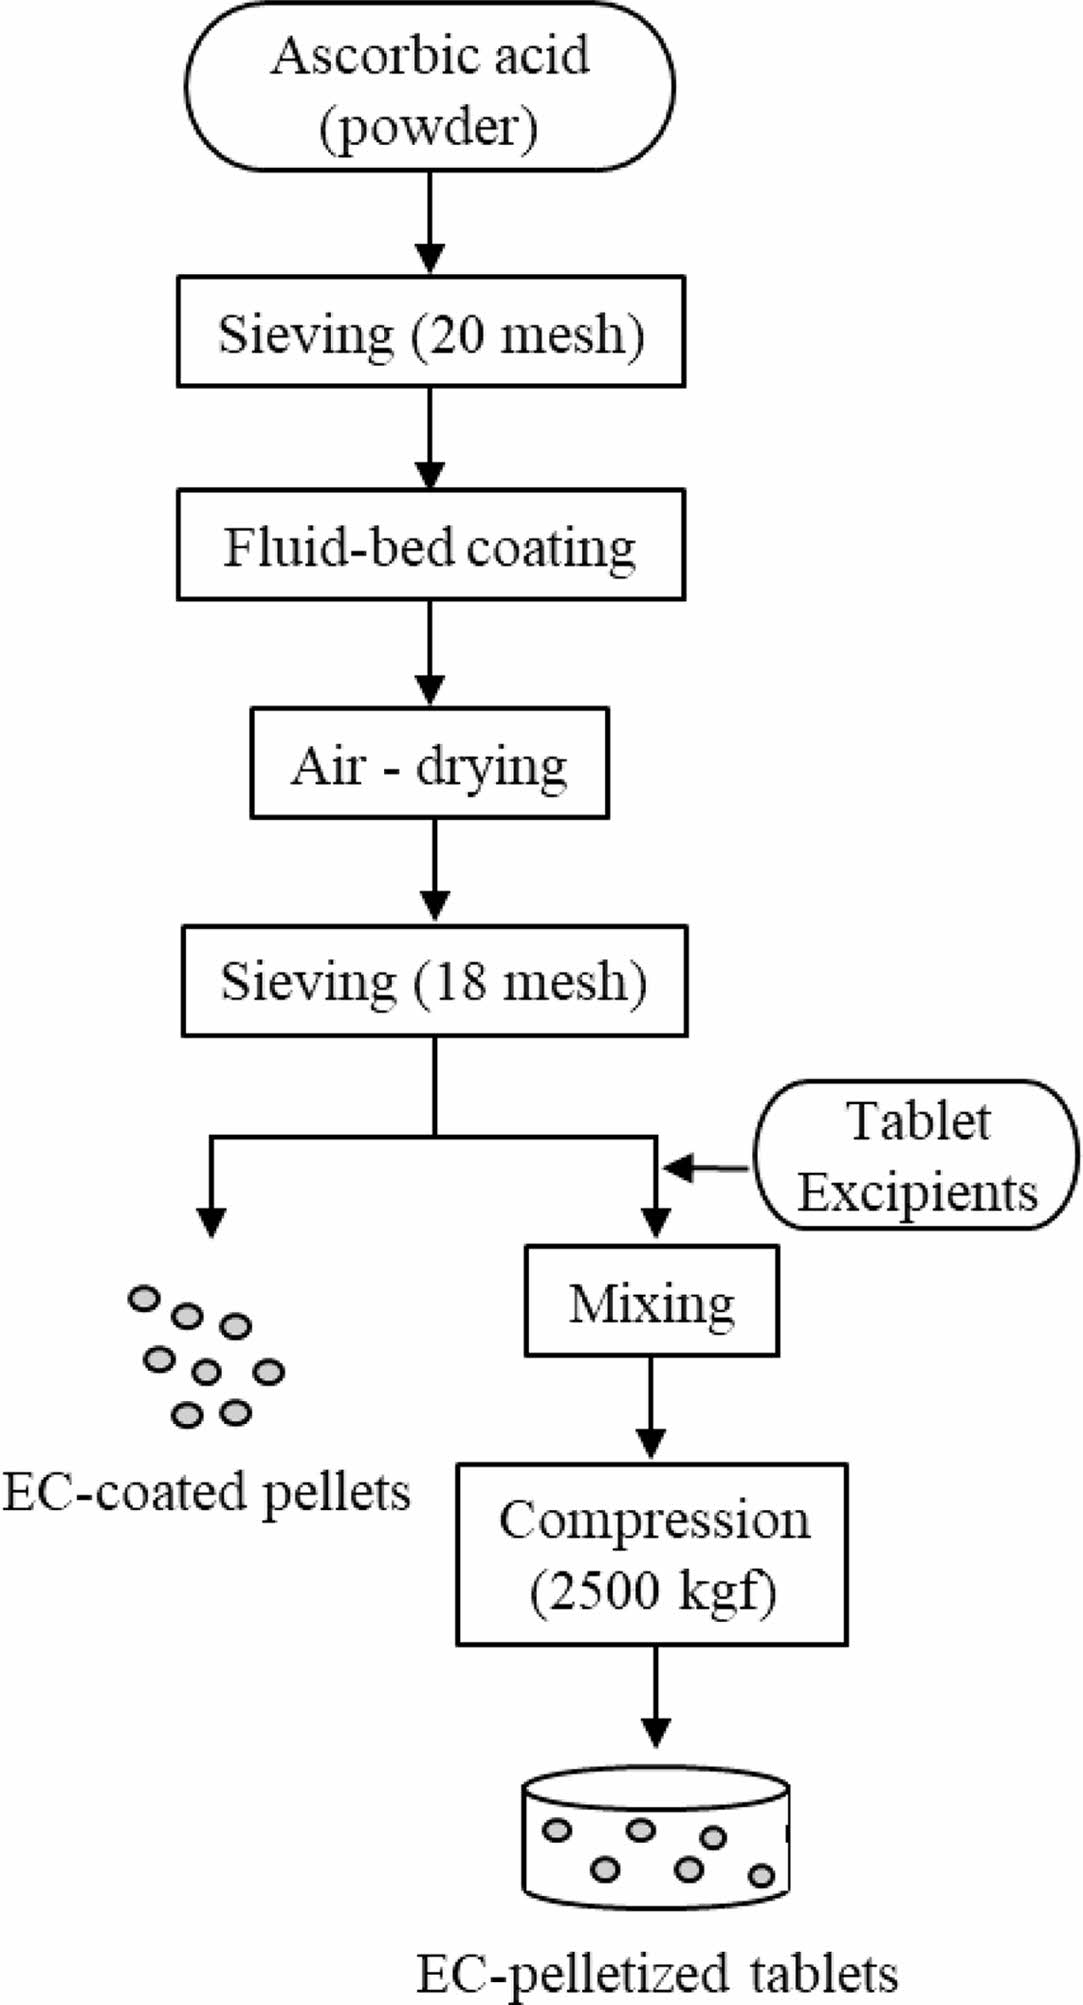
Scheme 2. Flow chart for the manufacture of EC-coated pellets and EC-pelletized tablets.
UV Analysis of AA. We determined the aqueous concentration of AA in the dissolution medium by measuring the absorbance at 245 nm using a UV spectrophotometer (Molecular Devices, Sunnyvale, CA, USA). We dissolved the accurate amount of AA powder in 5% (w/v) metaphosphoric acid aqueous solution and appropriately diluted it to various concentrations (100, 50, 25, 10, 5, 2.5, 1, 0.5, and 0.25 μg/mL). We obtained the calibration curve by least-square linear regression in the range of 0.25-100 μg/mL, with a coefficient of determination (r2) value of >0.99.
In Vitro Dissolution Study. We performed an in vitro dissolution test according to the USP apparatus II (paddle) method with a Vision Classic 6TM dissolution tester and a Vision heater (Hanson, Chatsworth, CA, USA) at 37±0.5 ℃. The samples tested were three commercial AA tablets (reference products), HTs, EPs, and ETs. We used a 5% metaphosphoric acid aqueous solution as the dissolution medium (900 mL), and the revolution speed was 50 rpm. At predetermined time points (5, 15, 30, 60, 90, 120, 180, 240, 300, 360, 480, and 720 min), we withdrew aliquots (5 mL) and passed them through a 0.45-μm polyvinylidene fluoride membrane filter. We replenished the medium with an equivalent volume (5 mL) of fresh 5% metaphosphoric acid aqueous solution to maintain a constant in vitro dissolution environment. We measured the amount of dissolved AA in the filtrate by UV analysis, as described above.
Calculation of the Similarity Factor (f2). To compare the dissolution behavior of the reference and test formulations, f2was calculated as follows:
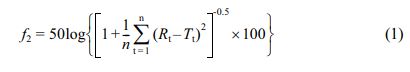
where f2 is the similarity factor, n is the number of observations, Rt is the percentage of the drug dissolved in the reference formulation, and Tt is the percentage of the drug dissolved in the test formulation.
Statistical Analysis. All data are represented as mean±standard deviation. We evaluated statistical significance using Student’s t-test, and we considered p<0.05 as statistically significant.
|
Table 2 Composition of HTs by Direct Compression Method (Unit : mg) |
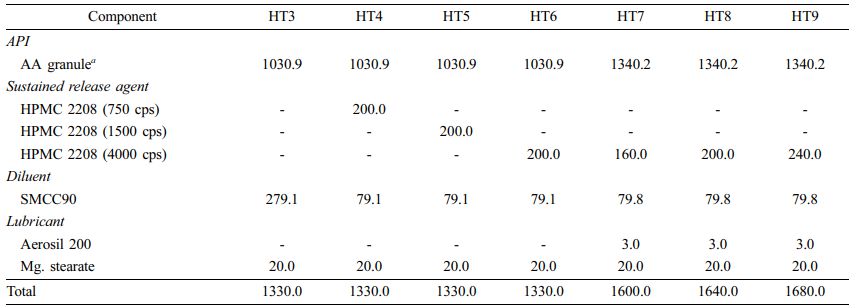
a Direct compressible AA; HPMC-coated (3%). |
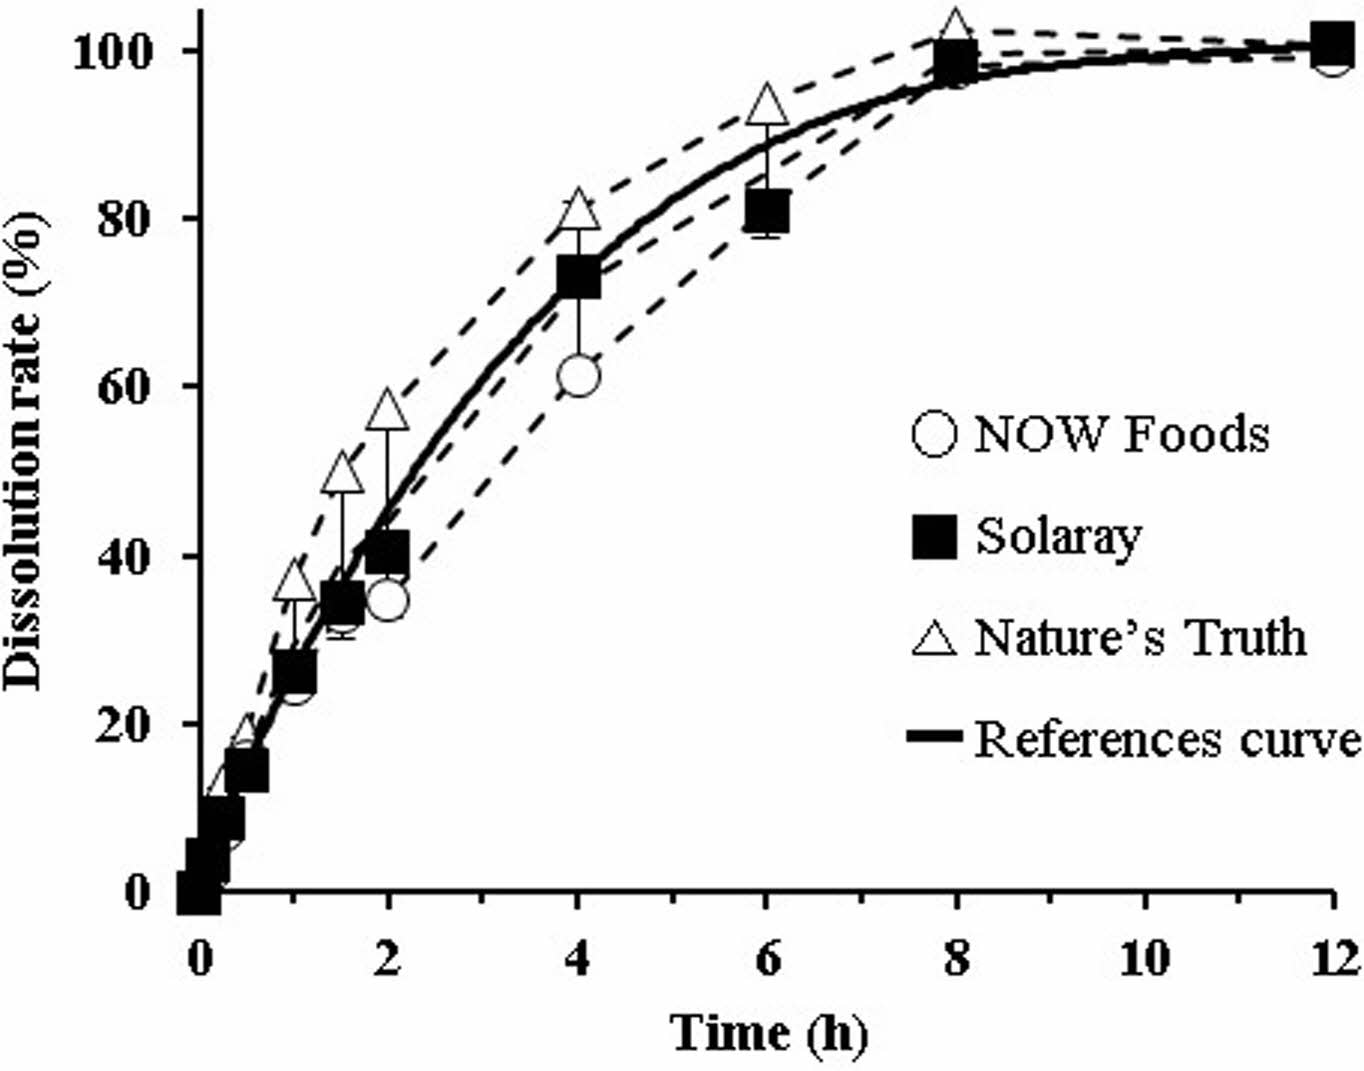
Dissolution Profiles of Reference Tablets. Dissolution test was carried out using 5% metaphosphoric acid solution. AA has been known as an antioxidant, and it can be easily oxidized in the presence of oxygen.22 Hence, to prevent oxidative degradation of AA during the test, metaphosphoric acid was added to the dissolution medium. The dissolution profiles of the three reference tablets (NOW Foods®, Solaray®, and Nature’s Truth®) are shown in Figure 1 as dotted lines, with the reference curve as the solid line. In all reference tablets, the dissolution rate gradually increased until 8 h, after which it plateaued. We did not observe a burst release. At the time of the end point (12 h), AA dissolution from the tablets was complete, showing >97% dissolution on average. In the presence of metaphosphoric acid, AA could be stabilized in aqueous solution because metaphosphoric acid provides more acidic environment to prevent AA from being ionized.23 In addition, metaphosphoric acid interrupts the catalyzing activity of metal ions (trace contaminants). Based on the report that 1-10% metaphosphoric acid exerts a protective effect against atmospheric oxidation,24 we regarded 5% metaphosphoric acid aqueous solution as a suitable dissolution medium that prevents AA degradation. The average dissolution rate of the three references was 26.3%, 59.3%, 80.6%, and 96.4% at 1, 3, 5, and 8 h, respectively. We curve-fitted these average values (y= 0.054x3-1.9465x2+23.586x+4.645) to obtain the representative dissolution profile, and we used the resultant reference curve for further comparison, including the calculation of f2 values.
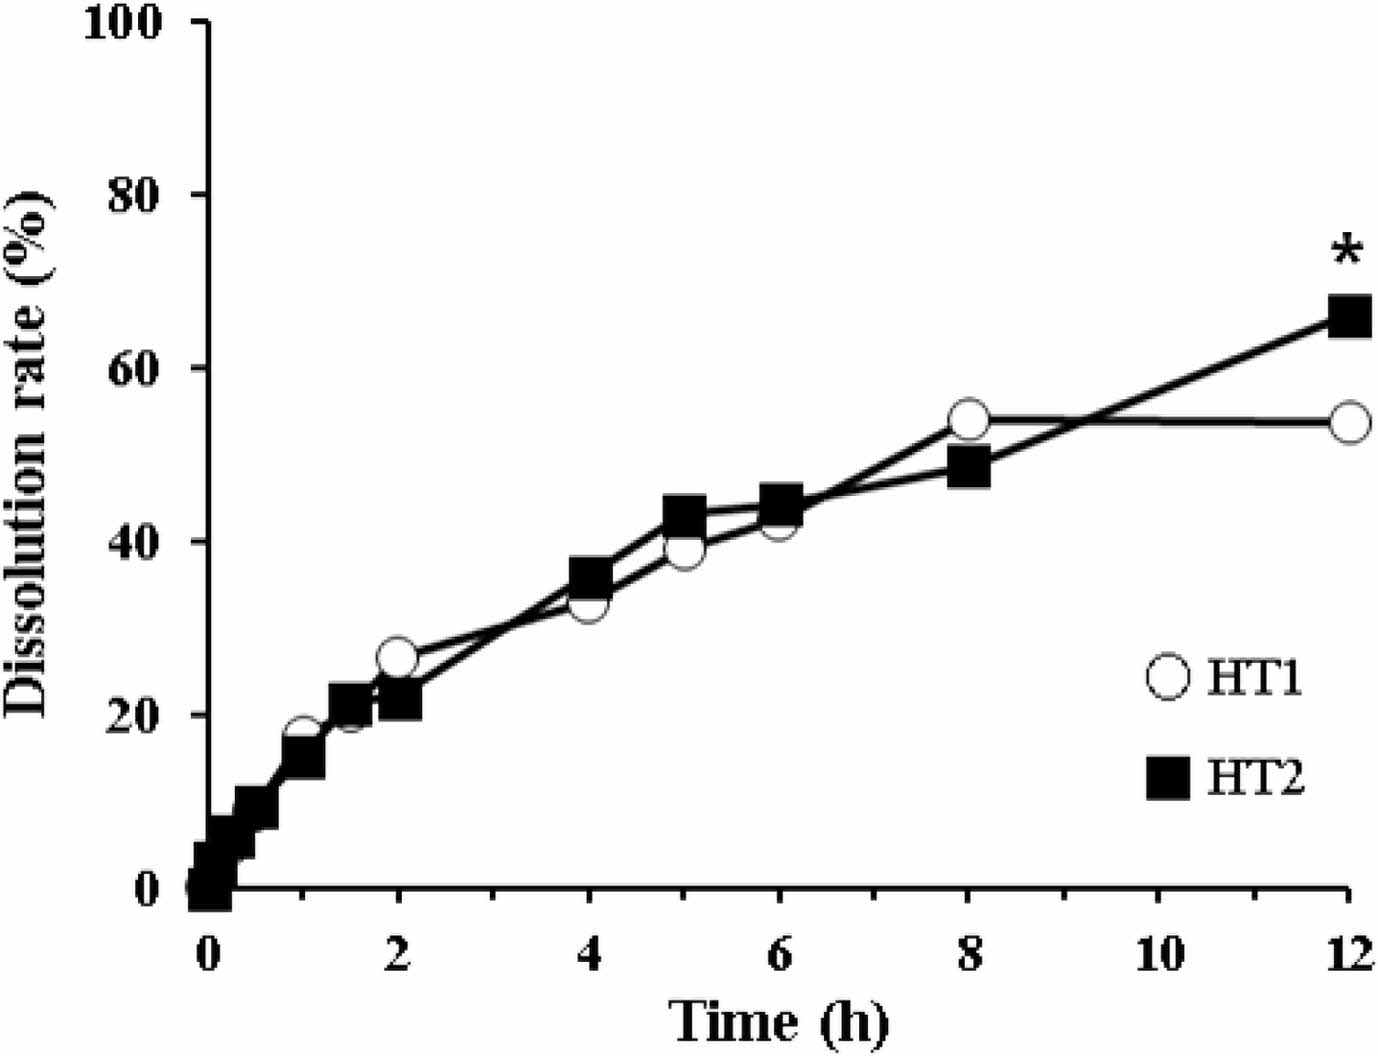
Dissolution Profiles of Dry Granulated HTs. The dissolution behaviors of dry granulated HTs are shown in Figure 2. HT1 and HT2 were the tablets containing HPMC with different viscosities (100000 cps and 4000 cps, respectively). Both tablets exhibited low dissolution, showing around 50% at 8 h and <60% at 12 h. Although the dissolution level of HT2 was somewhat higher than that of HT1, neither tablet was suitable for sustained release formulation. Moreover, we observed incomplete disintegration, wherein the partially eroded and/or broken fragments were still present (data not shown). In general, the high viscosity of HPMC disrupts the tablet dissolution: the higher the viscosity of HPMC, the harder it is for HPMC to be dissolved by the medium.15,25 Sung et al. reported that the release rate of 92 cps HPMC formulation (4.86±0.16% released/min1/2) was 1.53 times greater than that of 105300 cps HPMC formulation (3.17±0.03% released/min1/2). Moreover, at a high viscosity of HPMC (>15000 cps), there was no significant difference in the release rate constant.25 Thus, for subsequent formulations, we decided to switch the preparation method while selecting HPMC with low viscosity.
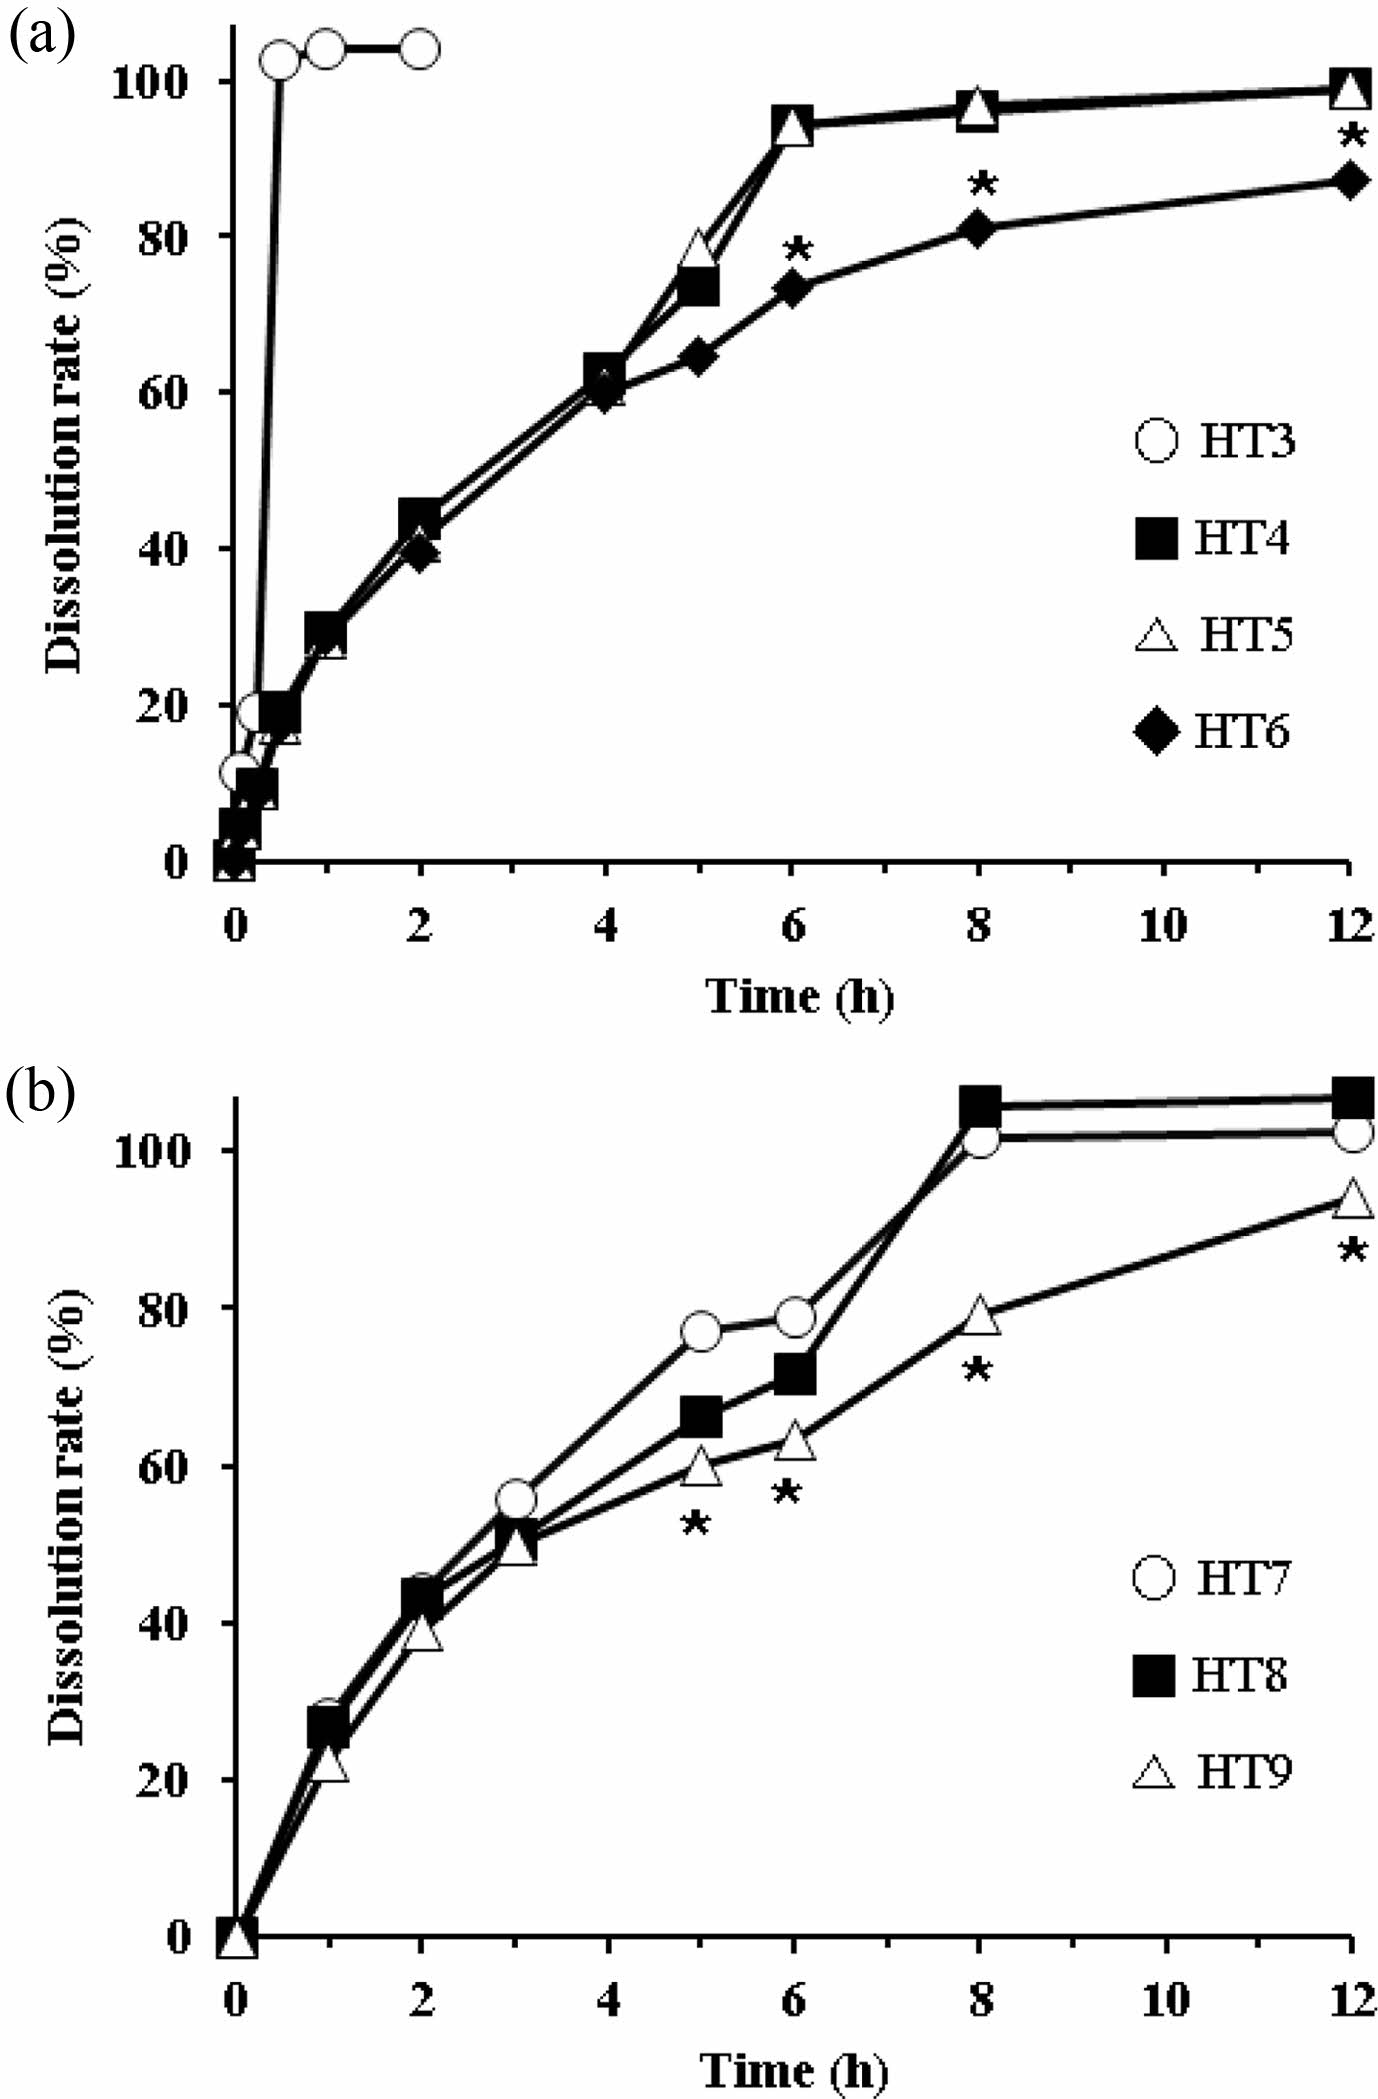
Dissolution Profiles of Directly Compressed HTs. As HPMC with high viscosity (more than 4000 cps) disrupts the dissolution of tablets, we employed HPMC with various viscosities (750, 1500, and 4000 cps). We prepared tablets with different viscosities using the direct compression method, in which we used AA granules (3 w/w% HPMC coated) to increase the flow property of the feed. First, based on the composition of HT2, we either added the same amount of HPMC (200 mg; HT4-HT6) or excluded it (HT3) for comparison. The dissolution profiles of these HTs are shown in Figure 3(a). As expected, the dissolution rate of HT3, which had no sustained release agent, was much higher at 2 h, but the rest of the tablets showed a sustained release profile. Until 4 h, there was no difference between tablets. However, afterward HT6 showed a lower dissolution rate than HT4 and HT5. A significant difference was observed at 6 h: AA release from HT4 and HT5 was complete, whereas that from HT6 was approximately 80%. This result supported the trend that the greater the viscosity of HPMC, the slower was the drug release.15,25 The sharp increase in the drug release from HT4 and HT5 was possibly due to the breakdown of the matrix. Although HT4 contained HPMC with a lower viscosity than that of HT5, the dissolution patterns of both tablets were not significantly different since HPMC with a viscosity below 1500 cps is not suitable for sustained release tablets. In contrast, HPMC with a viscosity of 4000 cps gradually liberated AA without rapidly collapsing the matrix. Drug release from the HPMC matrix is governed by swelling and/or erosion.15,21 Based on these results, we selected HPMC with a viscosity of 4000 cps as the most appropriate sustained release agent for subsequent formulations.
Second, we prepared HT7-HT9 by varying the amount of HPMC 4000, increasing the amount of AA granules, and adding Aerosil 200 as a lubricant to facilitate direct compression. The dissolution profiles are shown in Figure 3(b). HT9, which used the highest amount of HPMC (240 mg), showed a lower dissolution rate than HT7 and HT8 (160 mg and 200 mg HPMC, respectively). HPMC absorbs water, swells, then forms a gel in the GI tract.14 As the amount of HPMC increases, the diffusion path of the drug molecule increases. Thus, the diffusion coefficient of the drug is influenced by the amount of HPMC employed.15 At the endpoint (12 h), the dissolution rate of HT9 did not reach 100%, unlike that of HT7 or HT8. Thus, we recommend HT7 or HT8 as a proper formulation.
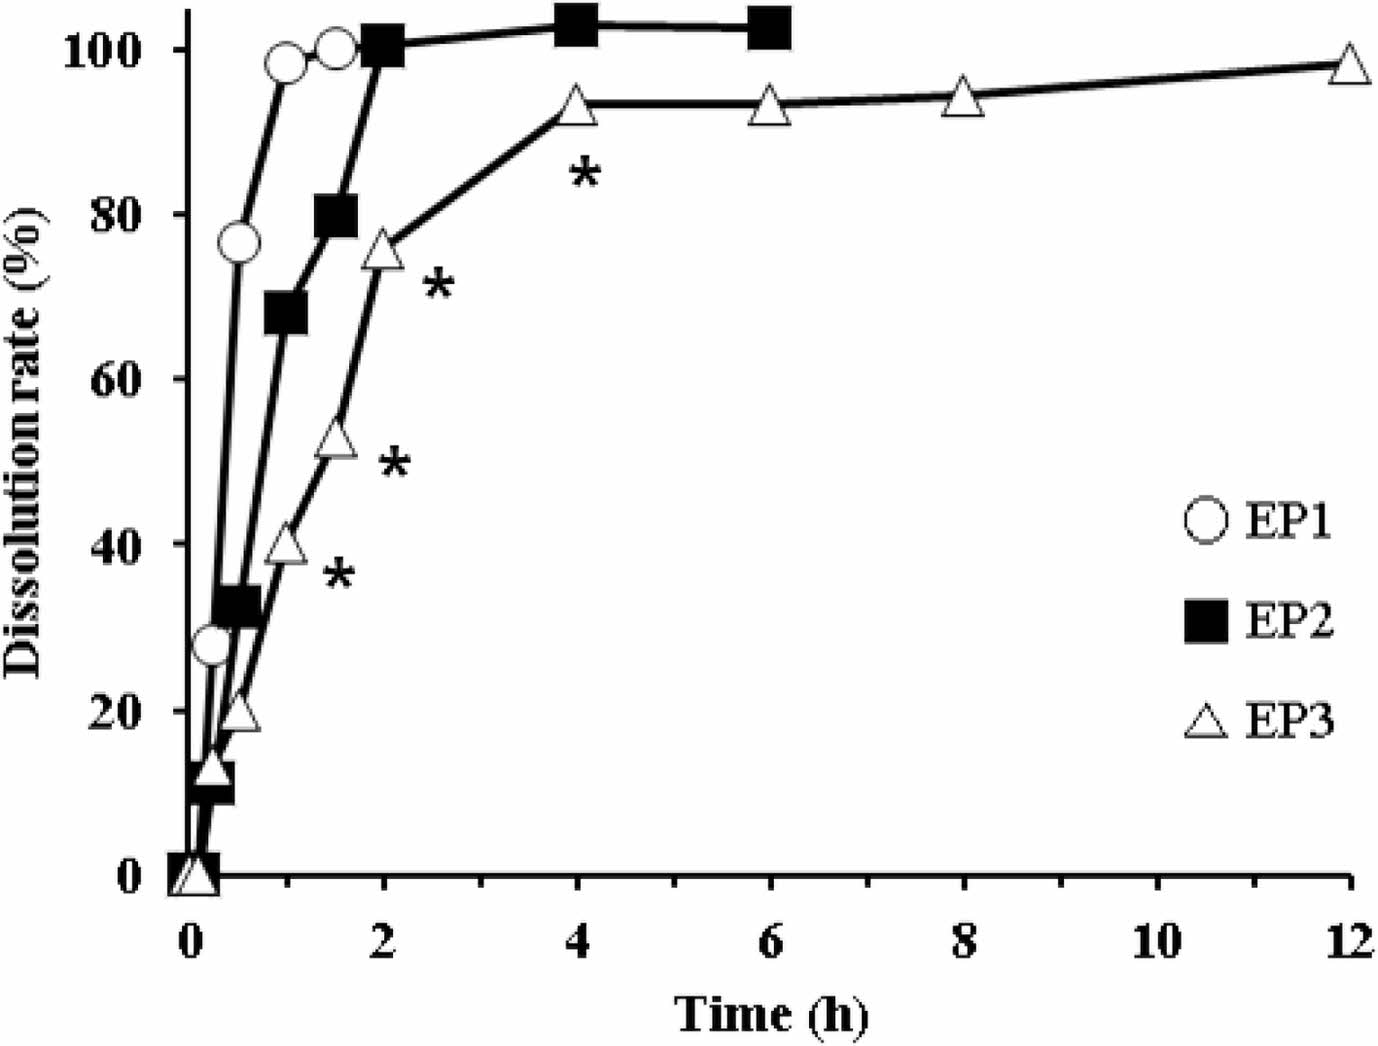
Dissolution Profiles of EPs. The dissolution rate of EC-coated pellets is shown in Figure 4. We prepared the pellets using different proportions of the coating agent (EC, TEC, and talc). The proportion of the coating agent for EP1, EP2, and EP3 was 10.70%, 18.46%, and 24.34%, respectively. As the proportion of the coating agent increased, AA release from the pellets decreased. EP1 and EP2 showed a fast release, resulting in complete dissolution within 1 h and 2 h, respectively. In contrast, EP3 had a somewhat delayed release, but it completely released AA within 4 h. Overall, AA release from the pellets was too rapid to meet the requirement for sustained release. Thus, we decided to modify the tablet formulation using EC-coated pellet (EP3).
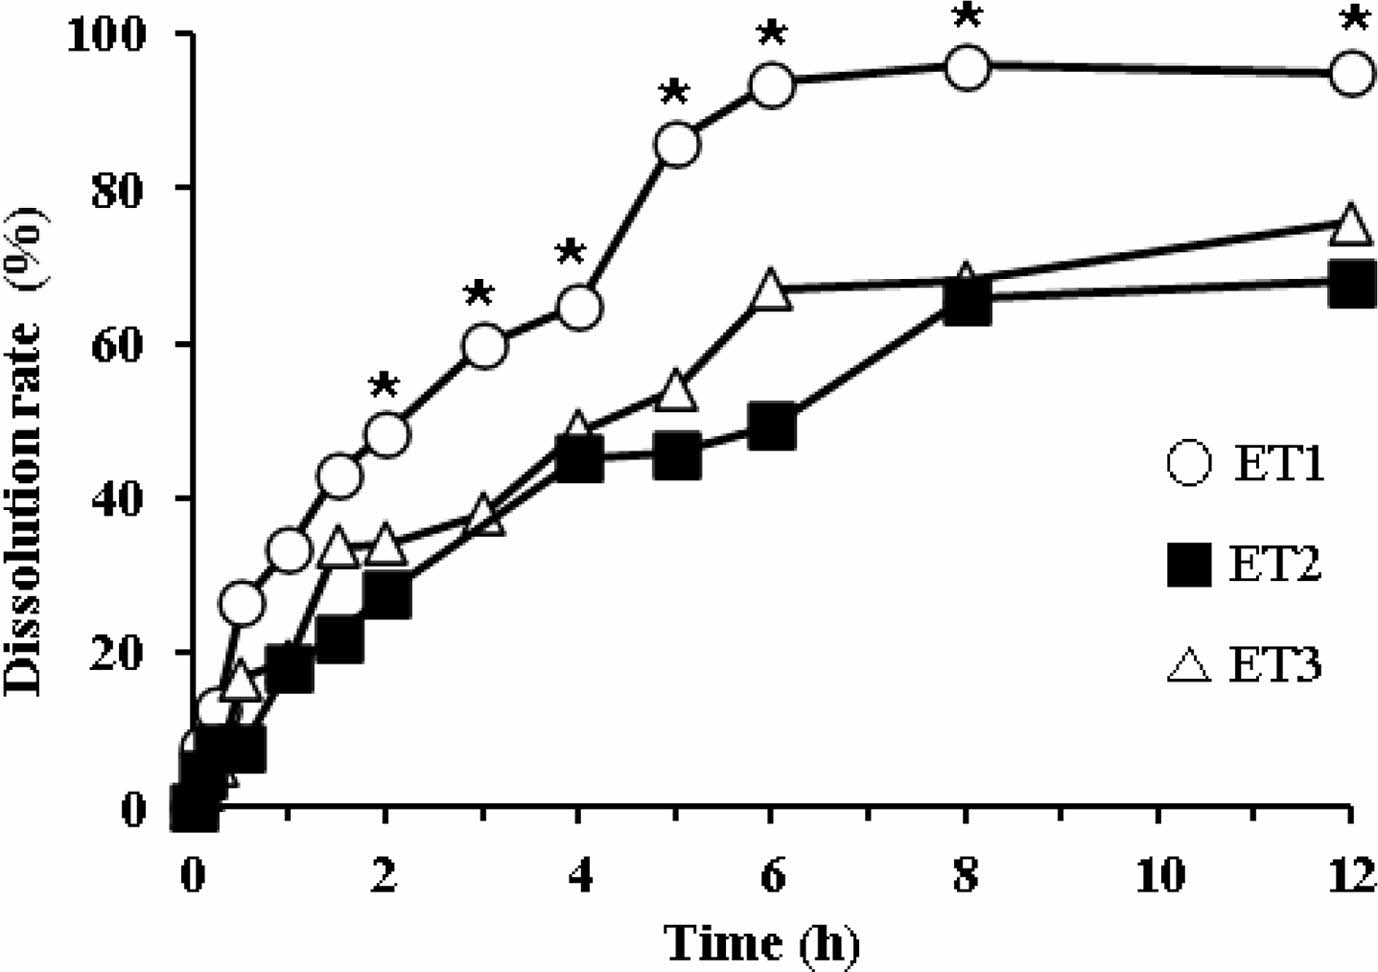
Dissolution Profiles of ETs. To modify the drug release pattern of EP3, we tableted it by direct compression using SMCC90 (diluent) and magnesium stearate (lubricant). The dissolution profiles of ET1, ET2, and ET3 are shown in Figure 5. At higher compression pressures, the pellets fractured and fused with each other, resulting in decreased drug release compared to EPs. All tablets showed a decreased dissolution rate in a sustained release pattern. The dissolutions of ET2 and ET3 were not complete, resulting in approximately 70% release in 12 h. In contrast, ET1 showed complete drug release, reaching a plateau of >90% within 8 h. Thus, we selected ET1 as a proper formulation to meet the sustained release pattern. However, because of the water-insoluble property of EC, we found that these ETs were not completely disintegrated during the dissolution test, leaving a deformed ghost matrix (data not shown).
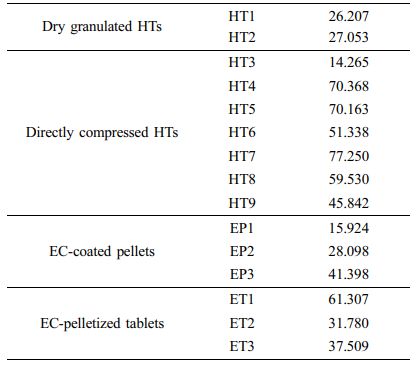
Comparison of Dissolution Profiles and Determination of Dissolution Tolerances. Based on the f2 values, we compared the dissolution profiles of all prepared formulations with the reference curve obtained above. We used 10 time points (5, 15, 30, 60, 120, 180, 300, 360, 480, and 720 min) for comparison, and the calculated f2values are listed in Table 5. The f2 values of dry granulated HTs and EC-coated pellets were smaller than 50, indicating dissimilarity between those samples. On the contrary, the f2values in the range of 50-100 represent a similar correlation between two products.20 Some of the directly compressed HTs and ETs revealed higher f2values. Particularly, HT7 and ET1 showed the highest values of 77.250 and 61.307 among the HT and ET groups, respectively. Thus, we selected these two formulations for further comparison.
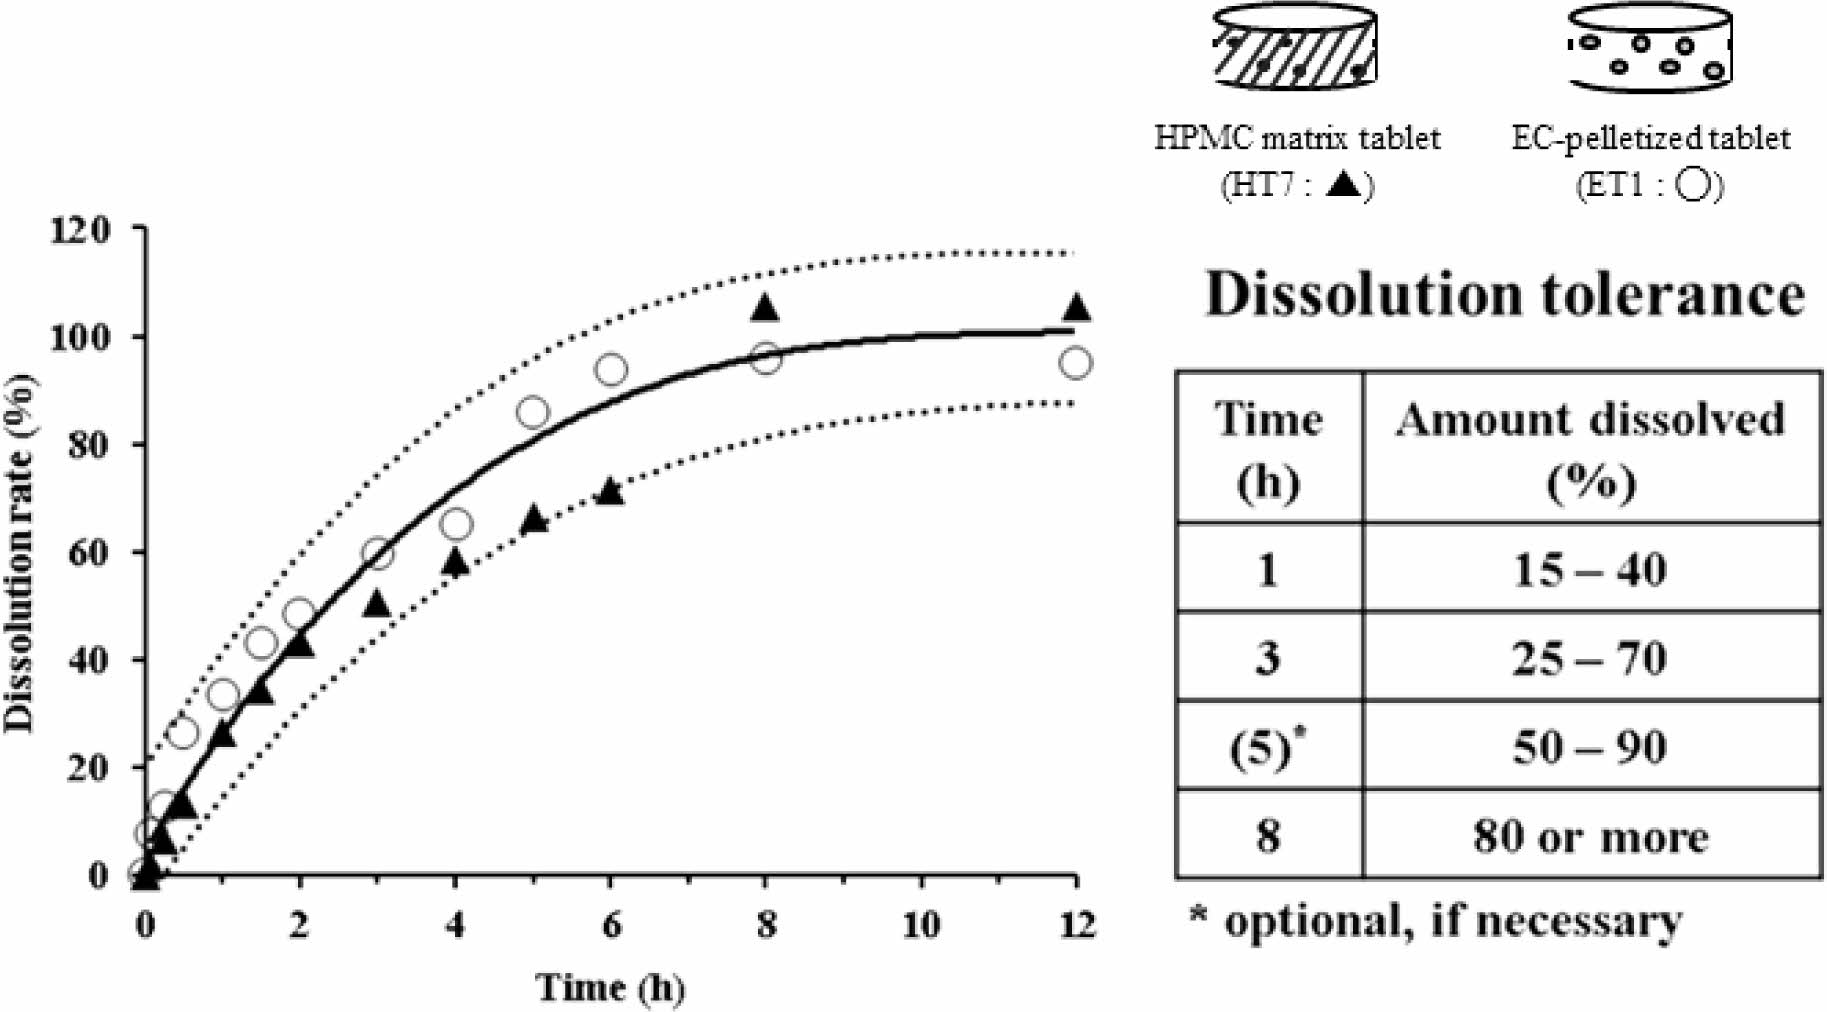
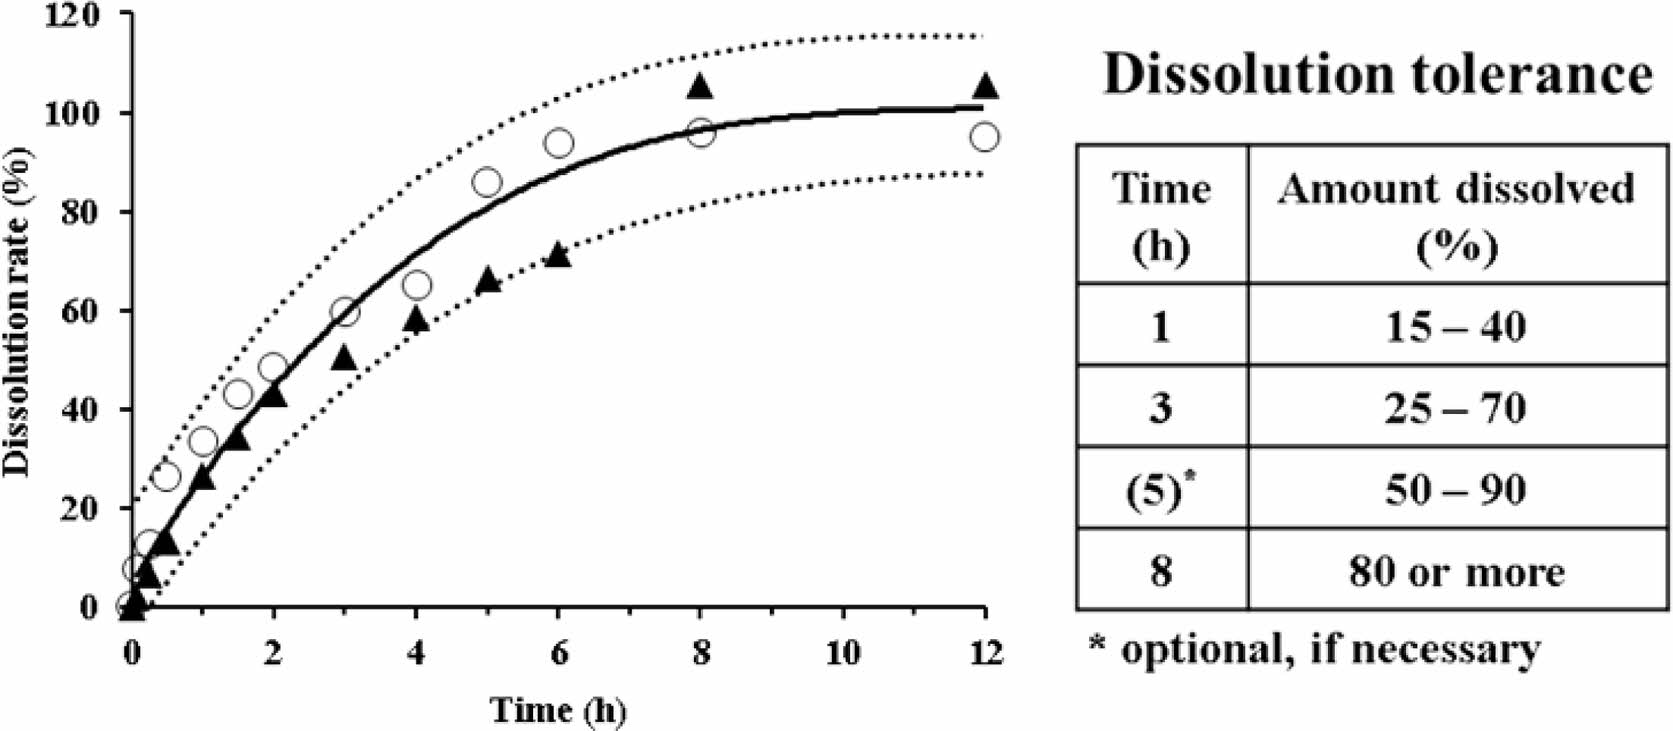
In Figure 6, along with the reference curve, the dissolution rates of the two selected formulations (HT7 and ET1) are plotted against time. The dotted lines represent a limit of ±15% of the reference curve. The dissolution rates of HT7 and ET1 were within this limit. However, their dissolution patterns were different. In comparison to the HT7 formulation, ET1 showed a rapid dissolution within 2 h and plateaued early-within 6 h. Based on these results, we could suggest the dissolution tolerance for a sustained release AA formulation (inset Table). In essence, we set two time points of dissolution tolerance when the dissolution reached over 50% and 80%, appointing 3 h and 8 h, respectively. We set additional time points around the midpoint dissolution between the two intervals, appointing 1 h and 5 h. Taken together, we suggest the range of dissolution tolerance for sustained release AA products to be 15-40% for 1 h, 25-70% for 3 h, 50-90% for 5 h, and ≥80% for 8 h. If reduced time points are required, the tolerance at 5 h could be optional and be used as a self-monitoring guide.
Release Kinetics. The drug release can be described by one or more mechanisms depending on the composition of the matrix, geometry, and dissolution medium. This can be explained by mathematical models that comply with the predictive value and model accuracy. To better understand the dissolution profile, we performed further kinetic analyses. We fitted the dissolution data to the first-order kinetic model (eq. (2)), the Korsmeyer-Peppas equation (eq. (3)), and the Hixson-Crowell equation (eq. (4)) as follows26,27:
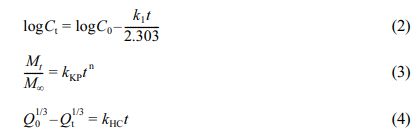
where C0 is the initial concentration of the drug and Ct is the concentration of the drug at time t. Q0 is the initial amount of drug loaded in the matrix, and Qt is the amount of drug that remains in the matrix at time t. Mt/M∞ is the fraction of the drug released at time t. n valueis the release exponent. k1, kKP,and kHCare the rate constants of the first-order model, Korsmeyer-Peppas, and Hixson-Crowell equations, respectively. The first-order kinetic model predicts a dependence of drug release on the concentration gradient between the static aqueous layer adjacent to the solid surface and the bulk liquid.28 Korsmeyer-Peppas model describes the diffusion-controlled drug release from a polymeric system, evaluating the release exponent (n value) of a time-dependent process.28 The Hixson-Crowell cube root law characterizes the release if there is a change in surface area and diameter of particles or tablets, indicating the erosion and diffusion mechanism.28 We applied the time points at which the dissolution rates plateaued (around 80-90%) for kinetic analyses. The correlation coefficients of determination and release rate constants are listed in Table 6. In the case of the reference curve, the coefficient of determination (r2)values were 0.819, 0.994, and 0.967 for the first-order, Korsmeyer-Peppas, and Hixson-Crowell equations, respectively. Similar trends were observed with the HT7 and ET1 formulations. Thus, the Korsmeyer-Peppas model provided the best fit regarding release kinetics.
The drug release mechanism from the polymeric matrix including the polymer erosion has been reported to follow three steps: first, the dissolution medium penetrates the matrix; then, matrix swelling with dissolution or matrix erosion occurs; finally, the dissolved drug is released into the surrounding dissolution medium.29 Drug release is controlled by the rate of penetration of the dissolution fluid into the matrix, in which aqueous front formation depends on the compressed structure.30 The release exponents (n value) of HT7 and ET1 were 0.787 and 0.714, respectively. As the values were in the range of 0.5 < n < 1, we noticed that the drug releases were followed by non-Fickian diffusion, which indicates the mechanism of diffusion- and/or erosion-controlled dissolution.
|
Figure 1 Dissolution profiles of three commercial AA tablets (dashed lines). The solid line represents the reference curve obtained by curve-fitting the average values. The dissolution medium was 5% metaphosphoric acid aqueous solution. Throughout the time points, no significant differences were found between tested samples. |
|
Figure 2 Dissolution profiles of HT1 and HT2 formulations in the 5% metaphosphoric acid aqueous solution. *Significantly different at p<0.05 versus relevant point of HT1. |
|
Figure 3 Dissolution profiles of different HT formulations in the 5% metaphosphoric acid aqueous solution. (a) HT3-HT6; (b) HT7- HT9. *Significantly different at p<0.05 versus relevant points of other formulations. |
|
Figure 4 Dissolution profiles of different EP formulations in the 5% metaphosphoric acid aqueous solution. *Significantly different at p<0.05 versus relevant points of other formulations. |
|
Figure 5 Dissolution profiles of different ET formulations in the 5% metaphosphoric acid aqueous solution. *Significantly different at p<0.05 versus relevant points of ET2 and ET3. |
|
Figure 6 Dissolution profiles of two selected formulations, ET1 (○) and HT7 (▲), in the 5% metaphosphoric acid aqueous solution. The solid and dotted lines represent the reference curve and a limit of ±15% of the reference curve, respectively. The inset table specifies the recommended dissolution tolerance. |
|
Table 6 Release Kinetic Parameters of Reference and Recommended Formulations |
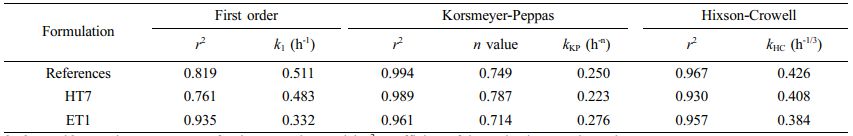
k1, kKP, and kHC are the rate constantsfor the respective model; r2 , coefficient of determination; n value, release exponent. |
In this study, we successfully developed sustained release AA tablets in the form of HTs and ETs using direct compression and/or fluidized coating. We obtained a dissolution reference curve from the average data of three commercial tablets and used it to calculate the similarity factor. We thus suggest dissolution tolerances of 15-40% (1 h), 25-70% (3 h), 50-90% (5 h), and ≥80% (8 h). The drug release rates of two selected formulations (HT7 and ET1) were within the limit of ±15% of the reference curve, when using the Korsmeyer-Peppas model.
- 1. Devaki, S. J.; Raveendran, R. L. Vitamin C: Sources, Functions, Sensing and Analysis [Online]; IntechOpen: London, 2017; pp 1-18. https://www.intechopen.com/chapters/56440 (accessed Sep 28, 2021).
-

- 2. Olmedo, J. M.; Yiannias, J. A.; Windgassen, E. B.; Gornet, M. K. Scurvy: A Disease Almost Forgotten. Int. J. Dermatol. 2006, 45, 909-913.
-
- 3. Gordon, B. L.; Galati, J.; Yang, S.; Katz, P. O.; Scherl, E. J. Vitamin C Deficiency: An Under-Recognized Condition in Crohn's Disease. ACG Case Rep. J. 2020, 7, e00424.
-
- 4. McGregor, G. P.; Biesalski, H. K. Rationale and Impact of Vitamin C in Clinical Nutrition. Curr. Opin. Clin. Nutr. Metab. Care 2006, 9, 697-703.
-
- 5. Choi, K. M.; Hoon, K. M.; Won, H. T.; Kim, J. D.; Kim, M. Y.; Jung, Y. R.; Shin, H. S. Comparative Bioavailability of Synthetic Vitamin C and Nutra-C (Calcium Ascorbate) in Korean Healthy Volunteers. Anal. Sci. Technol. 2016, 29, 162-169.
-
- 6. Hill, A.; Wendt, S.; Benstoem, C.; Neubauer, C.; Meybohm, P.; Langlois, P.; Adhikari, N. K. J.; Heyland, D. K.; Stoppe, C. Vitamin C to Improve Organ Dysfunction in Cardiac Surgery Patients-Review and Pragmatic Approach. Nutrients 2018, 10, 974.
-
- 7. Cha, J. H.; Hong, J. K.; Lee, S. W.; Cha, J. U.; Ko, W. H.; Baek, H. H.; Park, H. J. Dissolution Profile Analysis of Hydroxypropyl Methylcellulose-based Vitamin C Tablets. Korean J. Food Sci. Technol. 2012, 44, 274-279.
-
- 8. Perrie, Y.; Rades, T. Controlled-Release Dosage Forms. FASTtrack Pharmaceutics: Drug Delivery and Targeting; Pharmaceutical Press: London, 2012; pp 119-139.
- 9. Ray, B.; Gupta, M. M. Formulation and Evaluation of Once Daily Sustained Release Matrix Tablet of Verapamil Hydrochloride. J. Drug Delivery Ther. 2013, 3, 55-58.
-
- 10. Jaimini, M.; Kothari, A. Sustained Release Matrix Type Drug Delivery System: A Review. J. Drug Delivery Ther. 2012, 2, 142-148.
-
- 11. Chae, Y. B.; Kim, S. Y.; Kang, C. Y.; Park, J. B. Effect of Hydrophilic and Hydrophobic Polymers on the Sustained-release Sarpogrelate HCl from Matrix Tablets. Yakhak Hoeji 2020, 64, 446-453.
-
- 12. Shin, T. H.; Ho, M. J.; Kim, S. R.; Im, S. H.; Kim, C. H.; Lee, S.; Kang, M. J.; Choi, Y. W. Formulation and In Vivo Pharmacokinetic Evaluation of Ethyl Cellulose-coated Sustained Release Multiple-unit System of Tacrolimus. Int. J. Biol. Macromol. 2018, 109, 544-550.
-
- 13. Yamada, T.; Onishi, H.; Machida, Y. In Vitro and In Vivo Evaluation of Sustained Release Chitosan-coated Ketoprofen Microparticles. Yakugaku Zasshi 2001, 121, 239-245.
-
- 14. Wadher, K. J.; Kakde, R. B.; Umekar, M. J. Formulation of Sustained Release Metformin Hydrochloride Matrix Tablets: Influence of Hydrophilic Polymers on the Release Rate and In Vitro Evaluation. Int. J. Res. Contr. Rel. 2011, 1, 9-16.
- 15. Mughal, M. A.; Iqbal, Z.; Neau, S. H. Guar Gum, Xanthan Gum, and HPMC Can Define Release Mechanisms and Sustain Release of Propranolol Hydrochloride. AAPS PharmSciTech 2011, 12, 77-87.
-
- 16. Siepmann, F.; Hoffmann, A.; Leclercq, B.; Carlin, B.; Siepmann, J. How to Adjust Desired Drug Release Patterns from Ethylcellulose-coated Dosage Forms. J. Controlled Release 2007, 119, 182-189.
-
- 17. Siepmann, F.; Siepmann, J.; Walther, M.; MacRae, R. J.; Bodmeier, R. Polymer Blends for Controlled Release Coatings. J. Controlled Release 2008, 125, 1-15.
-
- 18. Nerdy, N. Determination of vitamin C in various colours of bell pepper (Capsicum annuum L.) by Titration Method. ALCHEMY Jurnal Penelitian Kimia 2018, 14, 164-177.
-
- 19. Fontannaz, P.; Kilinç, T.; Heudi, O. HPLC-UV Determination of Total Vitamin C in a Wide Range of Fortified Food Products. Food Chem. 2006, 94, 626-631.
-
- 20. Xie, F.; Ji, S.; Cheng, Z. In Vitro Dissolution Similarity Factor (f2) and In Vivo Bioequivalence Criteria, How and When Do They Match? Using a BCS Class II Drug as a Simulation Example. Eur. J. Pharm. Sci. 2015, 66, 163-172.
-
- 21. Shoaib, M. H.; Tazeen, J.; Merchant, H. A.; Yousuf, R. I. Evaluation of Drug Release Kinetics from Ibuprofen Matrix Tablets Using HPMC. Pak. J. Pharm. Sci. 2006, 19, 119-124.
- 22. Padayatty, S. J.; Levine, M. New Insights into the Physiology and Pharmacology of Vitamin C. Can. Med. Assoc. J. 2001, 164, 353-355.
- 23. Wechtersbach, L.; Cigić, B. Reduction of Dehydroascorbic Acid at Low pH. J. Biochem. Biophys. Methods. 2007,70,767-772.
-
- 24. Klimczak, I.; Gliszczyńska-Świgło, A. Comparison of UPLC and HPLC Methods for Determination of Vitamin C. Food Chem. 2015,175, 100-105.
-
- 25. Sung, K. C.; Nixon, P. R.; Skoug, J. W.; Ju, T. R.; Gao, P.; Topp, E. M.; Patel, M. V. Effect of Formulation Variables on Drug and Polymer Release from HPMC-based Matrix Tablets. Int. J. Pharm. 1996, 142, 53-60.
-
- 26. Bourne, D. W.; Banker, G. S.; Rhodes, C. T. Principles of Drug Absorption. Modern Pharmaceutics; CRC Press: Florida, 2002; pp 67-92.
- 27. Dash, S.; Murthy, P. N.; Nath, L.; Chowdhury, P. Kinetic Modeling on Drug Release from Controlled Drug Delivery Systems. Acta Pol. Pharm. 2010, 67, 217-223.
- 28. Singhvi, G.; Singh, M. In-vitro Drug Release Characterization Models. Int. J. Pharm. Stud. Res. 2011, 2, 77-84.
- 29. Kiortsis, S.; Kachrimanis, K.; Broussali, T.; Malamataris, S. Drug Release from Tableted Wet Granulations Comprising Cellulosic (HPMC or HPC) and Hydrophobic Component. Eur. J. Pharm. Biopharm. 2005, 59, 73-83.
-
- 30. Jeong, K. H.; Woo, H. S.; Kim, C. J.; Lee, K. H.; Jeon, J. Y.; Lee, S. Y.; Kang, J. H.; Lee, S.; Choi, Y. W. Formulation of a Modified-release Pregabalin Tablet Using Hot-melt Coating with Glyceryl Behenate. Int. J. Pharm. 2015, 495, 1-8.
-
- Polymer(Korea) 폴리머
- Frequency : Bimonthly(odd)
ISSN 0379-153X(Print)
ISSN 2234-8077(Online)
Abbr. Polym. Korea - 2023 Impact Factor : 0.4
- Indexed in SCIE
 This Article
-
2022; 46(2): 229-237
Published online Mar 25, 2022
- 10.7317/pk.2022.46.2.229
- Received on Nov 17, 2021
- Revised on Dec 23, 2021
- Accepted on Dec 28, 2021
Services
- Full Text PDF
- Abstract
- ToC
- Acknowledgements
- Conflict of Interest
Introduction
Experimental
Results and Discussion
Conclusions
- References
Shared
Correspondence to
- oung Wook Choi
-
College of Pharmacy, Chung-Ang University, 84 Heuksuk-ro, Dongjak-gu, Seoul 06974, Korea
- E-mail: ywchoi@cau.ac.kr
- ORCID:
0000-0003-2431-3995
Hyecheon Building(Room 601), #354, Gangnam-Daero, Gangnam-Gu, Seoul 06242, Korea
TEL : 82-2-568-3860, 561-5203, 569-3860 FAX : 82-2553-6938 E-mail: polymer@polymer.or.kr