


- Comparative Study of Tribological Properties of Multilayers Laminate Nanocomposites
Eman Ebrahim Nassar and Amal Ebrahim Nassar†

Department of Mechanical Engineering, Higher Technological Institute, 10th of Ramadan City, Egypt
- 다층 적층 나노복합체의 마찰학적 특성 비교 연구
Reproduction, stored in a retrieval system, or transmitted in any form of any part of this publication is permitted only by written permission from the Polymer Society of Korea.
Wear resistance studies for the multilayer laminate nanocomposite experimentally need a lot of time and money to investigate the effects of different parameters over it. Furthermore, the impact of these parameters on the surface occurs within a microsecond making the investigation very difficult. Statistical methods such as response surface methodology can be an effective technique in this matter. In the current work, the response surface methodology and the artificial neural network were used to design and analyze the weight loss at different temperatures, sliding speeds, applied loads, and weight percentages of graphene nanoplatelet (GNP) for multilayers laminate composite consists of polyurethane resin and anhydride hardener reinforced with 30 volume fraction of random fiber-glass. It was found that increasing GNP content could effectively increase friction coefficient and reduce the wear rate of multilayer laminate nanocomposite. The predicted values from artificial neural networks and experimental methods are found very close to each other.
Wear rate and friction coefficient of multilayer laminate composite were developed using small amount of graphene nanoplatelet (GNP).
Keywords: nanocomposites, wear resistance, response surface methodology, artificial neural network.
Information is available regarding the multilayer laminate composite, graphene nanoplatelet GNP, composite preparation and Parameters used in mathematical models. The materials are available via the Internet at http://journal.polymer-korea.or.kr.
PK_2021_045_05_655_Supporting_Information_template.pdf (271 kb)
Supplementary Information
Wear is one of the most common problems in industrial applications. It is also one of the main operations occurring as a result of friction when two elements were mating.1 There are many works discussed the parameters which effect on the rate of wear in the material surfaces.2-5
Materials subject to friction need wear tests to determine their wear resistance and to know their wear behavior. The complexity of processes occurring in the area of contact between mating elements makes it necessary to consider many different tribological parameters and the mechanical properties of materials. There are many parameters effect on the rate of wear, the hardness of pair elements microstructure, and mating condition.6 Dewan et al.7 reported that the coefficient of friction can be increased and the wear resistance reduced by using the right material pair. Tabor8 reported that wear resistance and friction force depend on the type of material, surface roughness, temperature and applied force. A polymer composite refers to the multi-phase material, it is prepared by reinforcing polymer with external fillers, to obtain synergistic properties.9 Multilayer laminate nanocomposites are referred as a multiple composite layers stacked together to obtain particular properties.10 These properties make it suitable in various areas, such as bridges, automobiles and furniture.11 Recently, a polymer is increasingly used as a compounding material in multilayers laminate nanocomposites for its superior characteristics.
Several researchers observed that wear in polymer follows the same behavior as the metal.12-15 In this context, multilayer laminate nanocomposites are promising alternatives as a wear resistance material. However, severe condition such as high temperature requires the use of high-performance reinforcement.16 Wear resistance of polymer composites is influenced by the amount and type of the used fillers.17 Today, composites based on epoxy and nanoparticles are certainly some of the most promising selections.18
There are a few studies concerning with wear behavior of polymeric composite under dry conditions and high temperatures are available.19-23 In the current work, we focus on the wear properties of multilayers laminate composite reinforced with nano filler. By using artificial neural network (ANN) analysis to create model to predict the values of weight loss (WL) and the values of friction coefficient of multilayers laminate composite as a functions of important wear factors. This model can be used to determine the effects of different parameters on wear rate and on coefficient of friction. Also, the predicted model can be used to identify appropriate amount from graphene nanoplatelet (GNP) that resisted the wear and improve the friction coefficient.
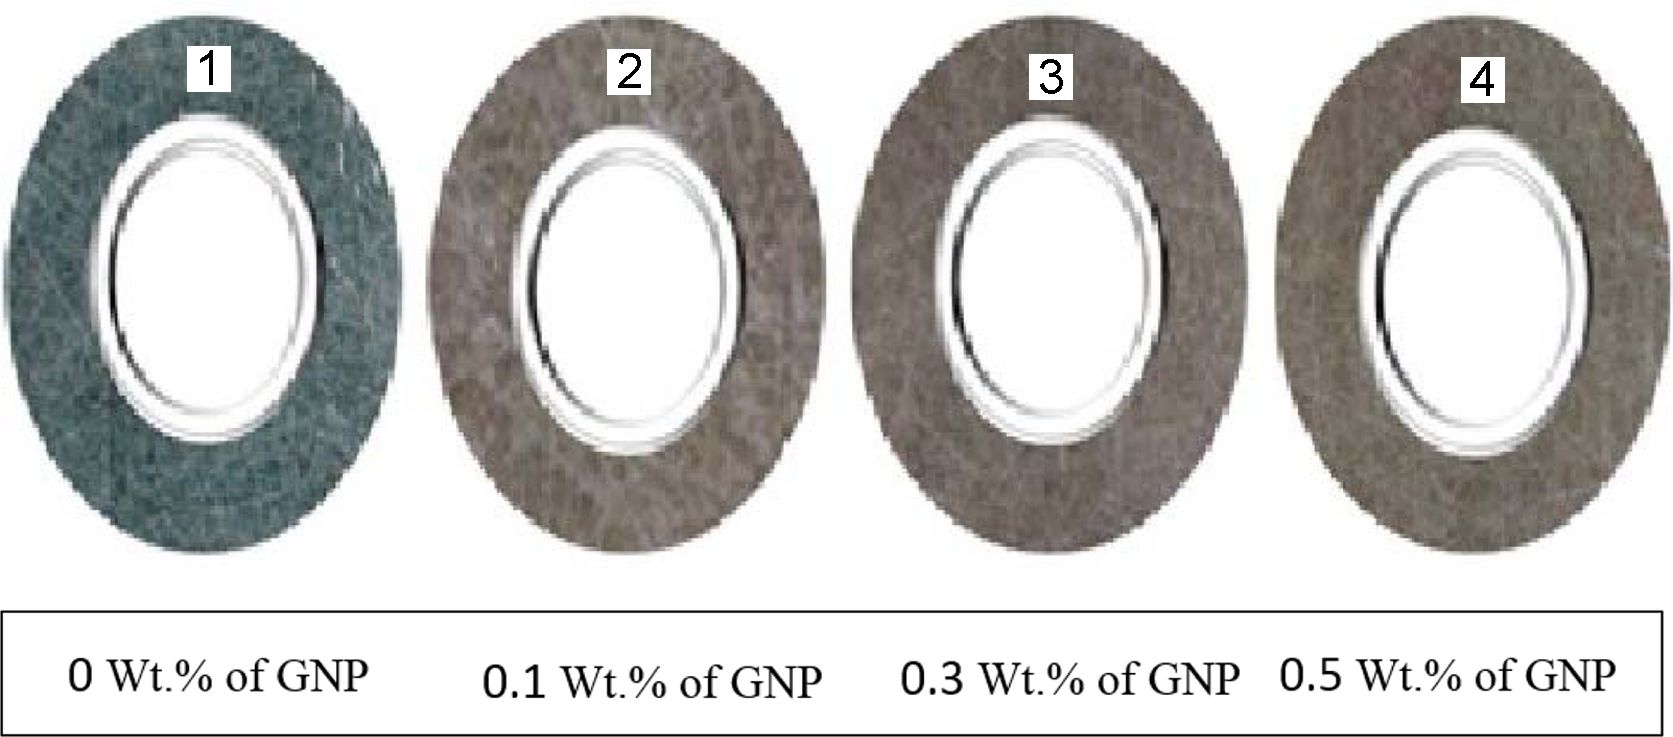
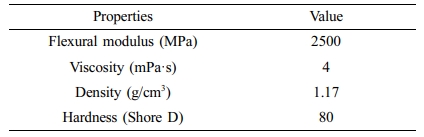
Materials. The material used in the current work is multilayer laminate composite consist of polyurethane resin and anhydride hardener reinforced with 30 volume fraction of random glass fibers. Resin Polyurethane PX-225 and hardener acid-anhydride were supplied from Axson Middle-East (Egypt). Full physical properties of resin and hardener at room temperature is illustrated in Table 1. The mixing ratio between resin and hardener was 1:0.75. The average length of selected fibers was 1.7 mm fabric weight was 363 g/m2, a small amount of GNP. It was purchased from Asbury, Inc (U.S.A) in a powder form with a thickness less than 8 nm. Graphene is a two-dimensional sheet of sp2 bonded carbon atoms, organized in a hexagonal lattice.24 It has unique morphology which make it superior in its thermal properties and mechanical.25 Three different wight percentages of GNP were used in the investigation: 0.1, 0.3, and 0.5. The description of the laminate composite preparation is described in previous work.26
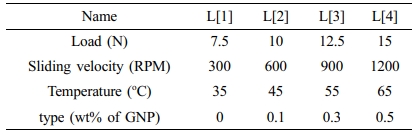
Experiments design for the wear properties is made by using response surface methodology with several parameters, Table 2 describes the full details of each parameter. The wear tests were performed on the ball-on-Disc dry sliding device equipped with heating system and actuator control to displacement control and load amount control. The ball was a Chrome Steel SAE 52100, with 6 mm diameter and 80 HRC hardness. It was contacted on the sample surface according to the conditions in Table 2. All tests were performed for an 80 m distance at each condition by using the T-01M tribometer. Samples were cut into ring-shaped with dimensions of outer diameter equal 46 mm and inner hole diameter equal 25 mm, the thickness of the ring was 6 mm forming process of samples made by laser cutting machine to shape shown in Figure 1.
All samples were cleaned with ethanol before the test. The results were recorded from an average of three tests for each condition. The values of the change in the specimen weight were recorded to calculate the amount of WL, on the other hand, the coefficients of friction were obtained from the friction force. The effect of the ball over the sample surface was analyzed using WL measurement and optical microscope.
Optimization of Multi-Objective. Response Surface Methodology (RSM): RSM is a method for improving polynomial function to better represent experimental results to make the statistical inferences more beneficial.27 In current investigation RSM was used to model WL and friction coefficient of multilayer laminate nanocomposites. There were 72 experimental response values of different factors combination used in the surface response formulate (WL and friction coefficient) as shown in Table S1 (see the Supporting Information). Design-Expert V12 software was used to create all possible combinations between the factors and to create the empirical model.
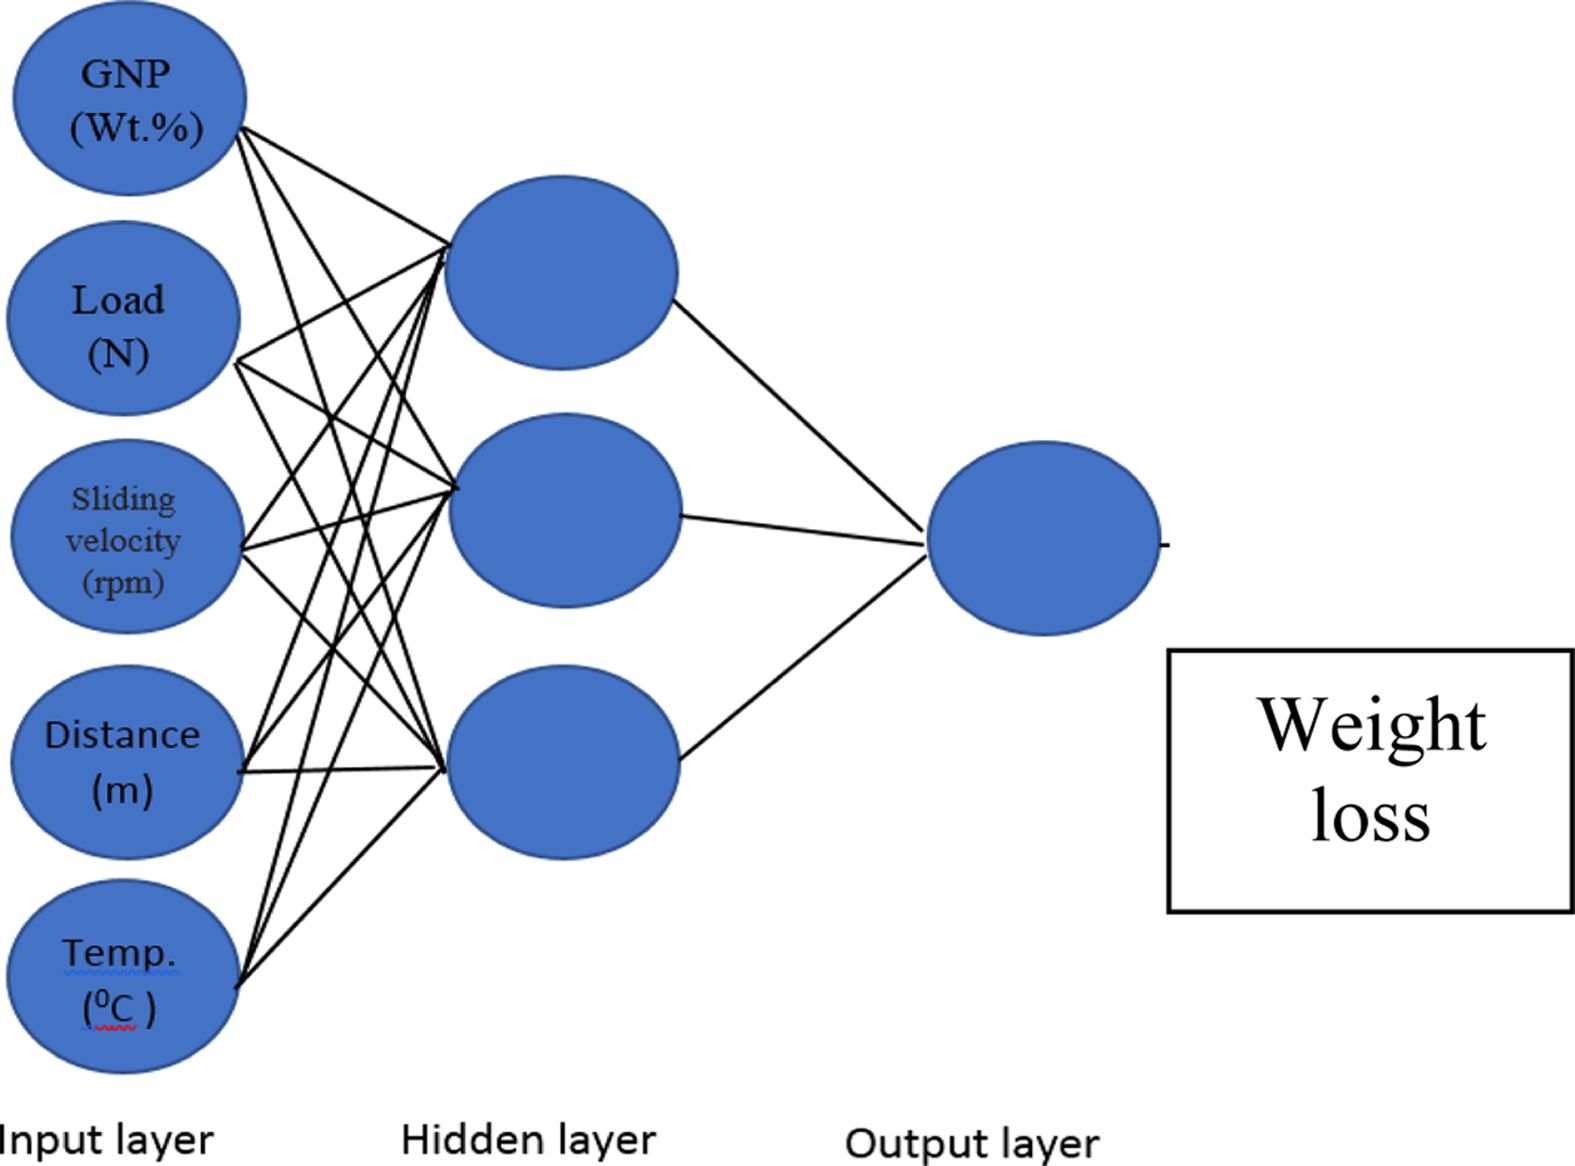
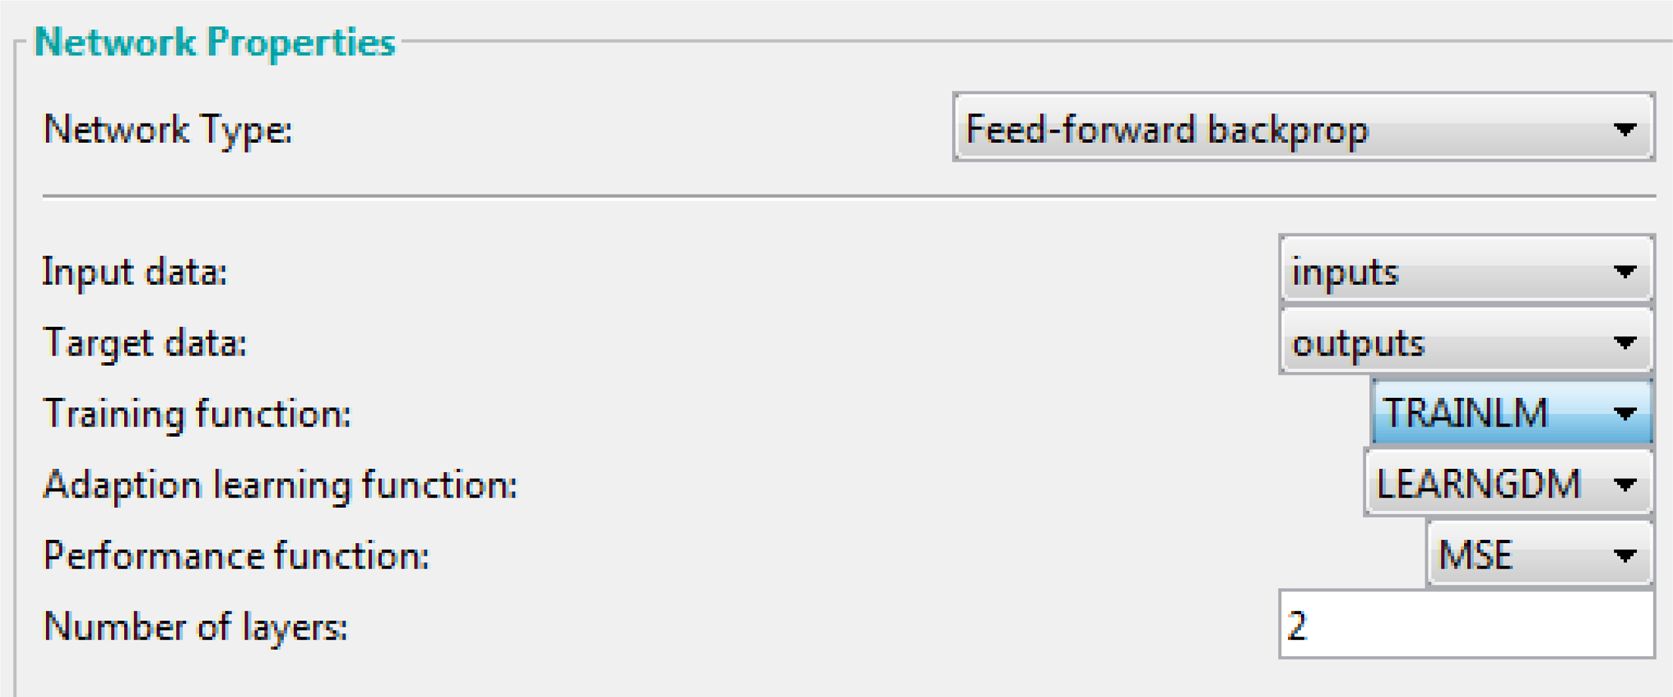
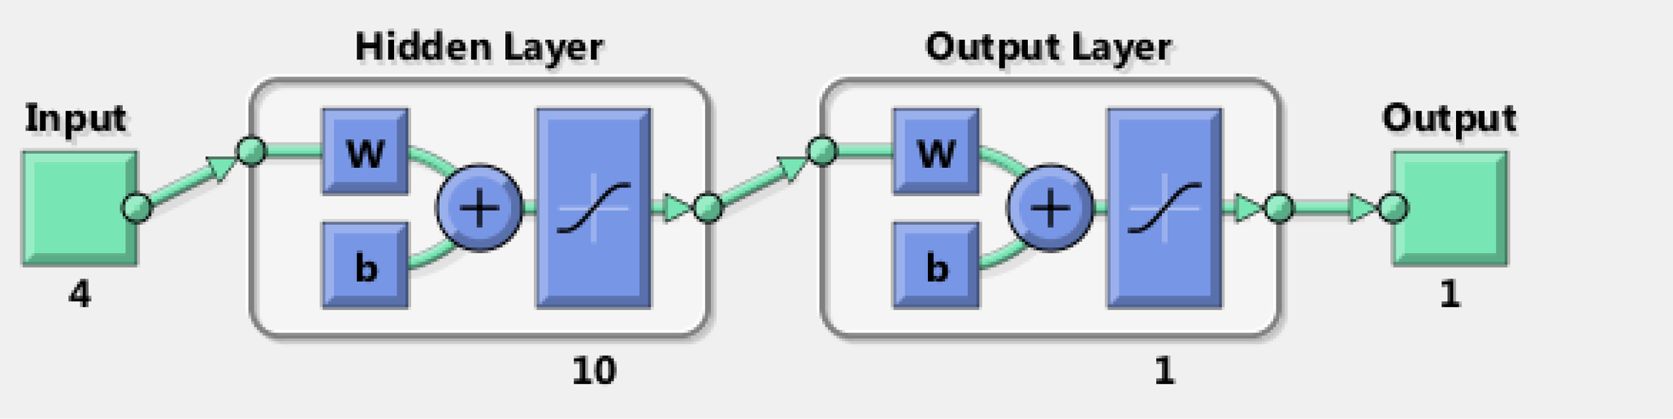
Artificial Neural Networks (ANNs). ANN is one of the computational tools that has used extensively to solve many sophisticated real world problems.28 The ANNs have a remarkable ability in the data processing characteristics relevant to high parallelism, non-linearity, noise and fault tolerance, and deep learning.29 It is a method to simulate a wide range of engineering problems. In the ANN method, non-linear and multivariable models can be handled to obtain an accurate solution. The main idea of this approach is the unique construction for the system of information processing, this system has a massive number of processing elements or neurons working in harmony to find the solution to the problem.30-32 Function of ANN relies upon the weight of the associations between each node performed in the learning and training process according to the predefined pattern. The process of training and learning is a repeated process until the variance between the anticipated value and actual value is very limit,33 In Neural Networks the process of training and learning was developed in MATLAB according to the feed forward back propagation method and by the assists of obtained experimental results.34 The required number of neurons for the hidden layer was changed by trial and error to reach minimum deviation for experimental results prediction; ten neurons were required to build the model by using RSM obtained data. Figure 2 shows a typical structure of ANN for predicting WL. In the structure, there are 3 numerical input parameters (Load (N); Sliding velocity (RPM); Temperature (oC)) and one ordinal parameter that is the type of sample (D) such as Polyurethane composites without GNP, polyurethane composites with GNP (0.1 wt%), polyurethane composites with GNP (0.3 wt%), polyurethane composites with GNP (0.5 wt%). Sample (D) is assigned with numerical values such as 0, 0.1, 0.3, 0.5 referred as the wt% of GNP. Bias and weights of the network ware changed until the mean squared error (MSE) arrives at the least satisfactory value. Out of 72 experiments, 80% is used in training, 10% is used in testing and 10% is used in validation process. Figure 3 shows the properties of network. The network performance was measured by using MSE function. Figure 3 illustrates a screenshot for the neural network properties in MATLAB. Figure 4 represents the neural network used in the investigation.
|
Figure 1 View of the samples used in the study. |
|
Figure 2 Typically structure of ANN for predicting wear rate. |
|
Figure 3 Neural network properties. |
|
Figure 4 Neural network. |
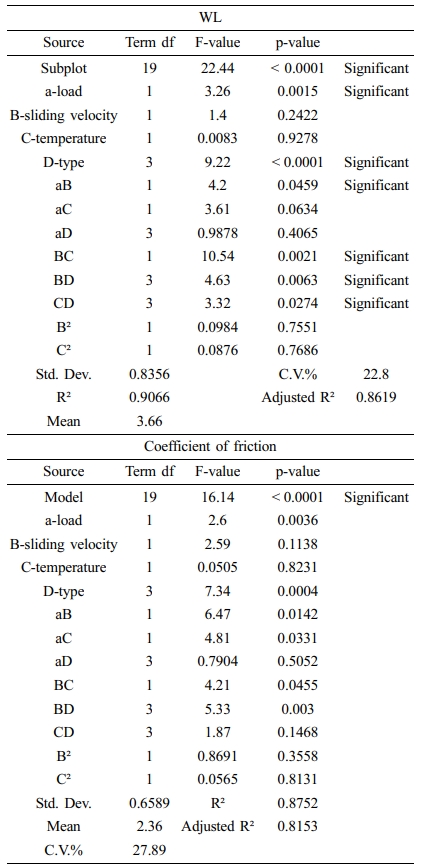
The RSM was used to study the effect of sliding velocity; temperature; load and wt% of reinforcement on WL and friction coefficient of multilayers laminate nanocomposites and to create the empirical model for WL and friction coefficient based on the effects of these factors. The sequential F-test was used to test the significance for regression model. Table 3 shows variances analysis of WL and friction coefficient for interaction effects factors. The F-value of model equal to 22.44 which confirms the significance of the model. Interaction factors: temperature (oC); load (N), as well as sliding velocity (RPM) and type (wt%) also have an impact on WL value. The adjusted R2 value of 0.8619 is in good concurrence with the predicted R2 value of 0.8153 since the difference between them is less than 0.20. According to results of RSM, the ideal values of temperature, load, sliding speed, and wt% of GNP are 35, 7.5, 300, and 0.3 respectively to obtain the minimum WL of multilayer laminate nanocomposites. In addition to that table shows load and wt% of GNP are a significant parameters as their p-values were less than 0.05. Furthermore terms (CD), (BD) and (BC) are also considered as a significant parameters, these terms were added automatically to support hierarchy of the model. The optimum condition to reduce the WL and to increase friction coefficient will at low sliding speed, low load, low temperature, and a medium amount of reinforcement.
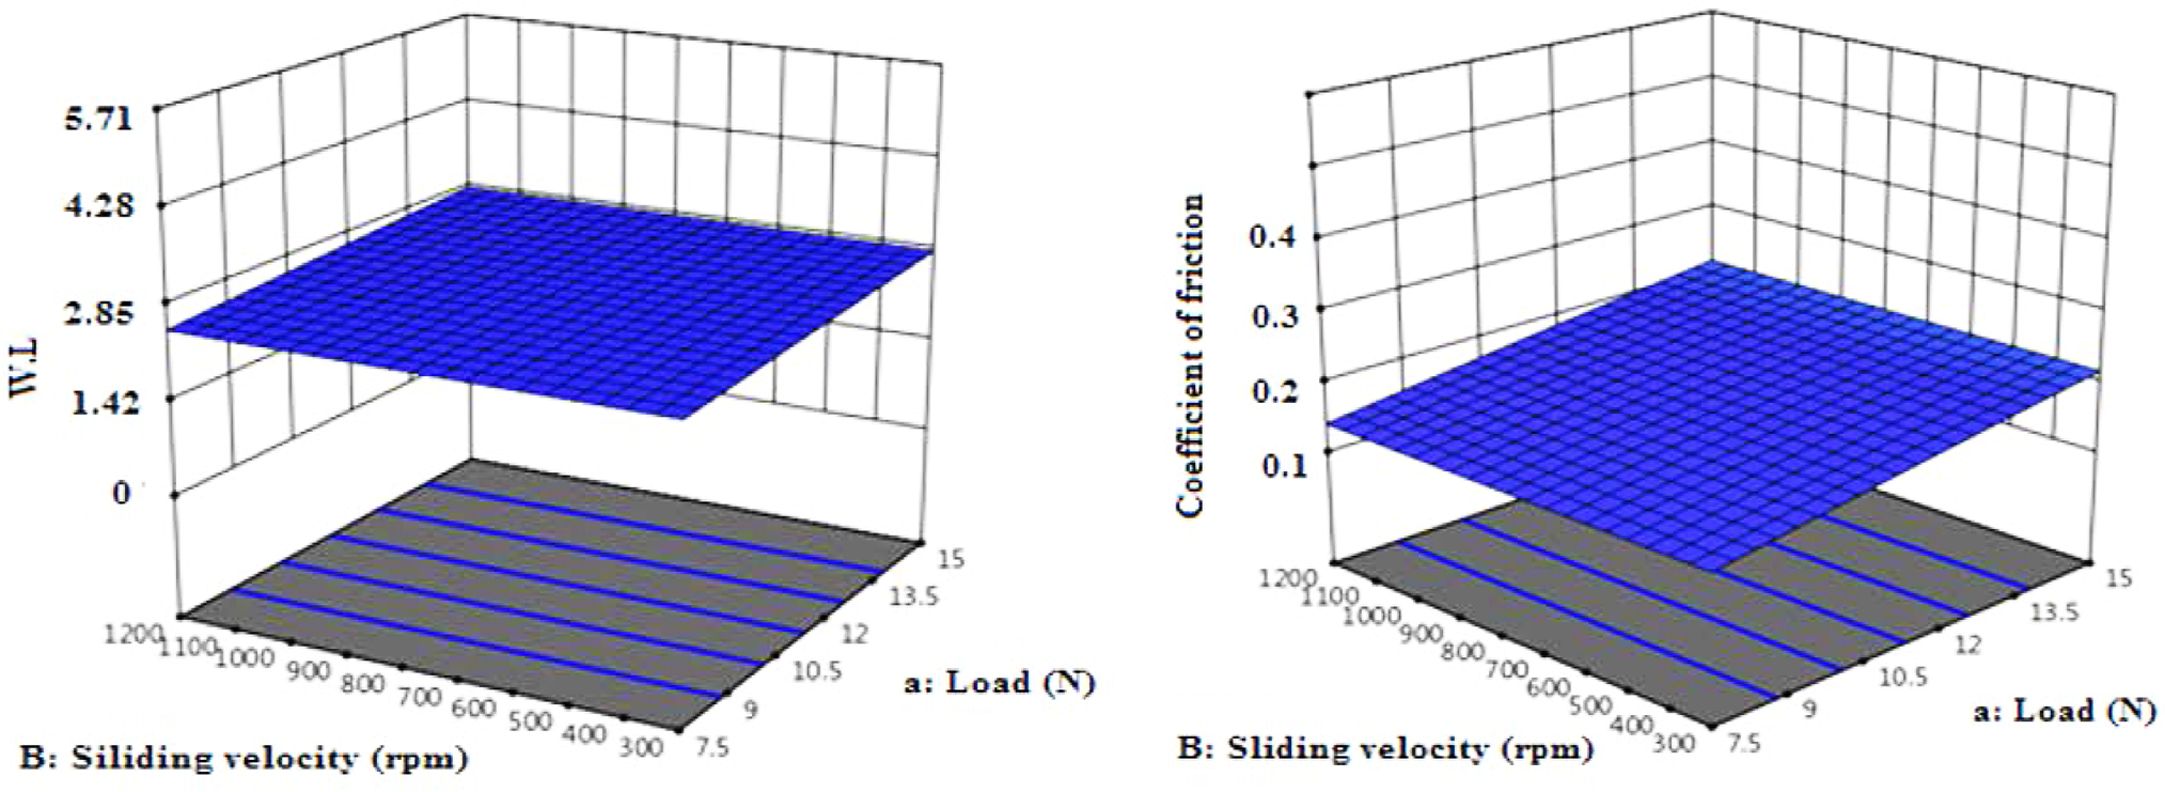
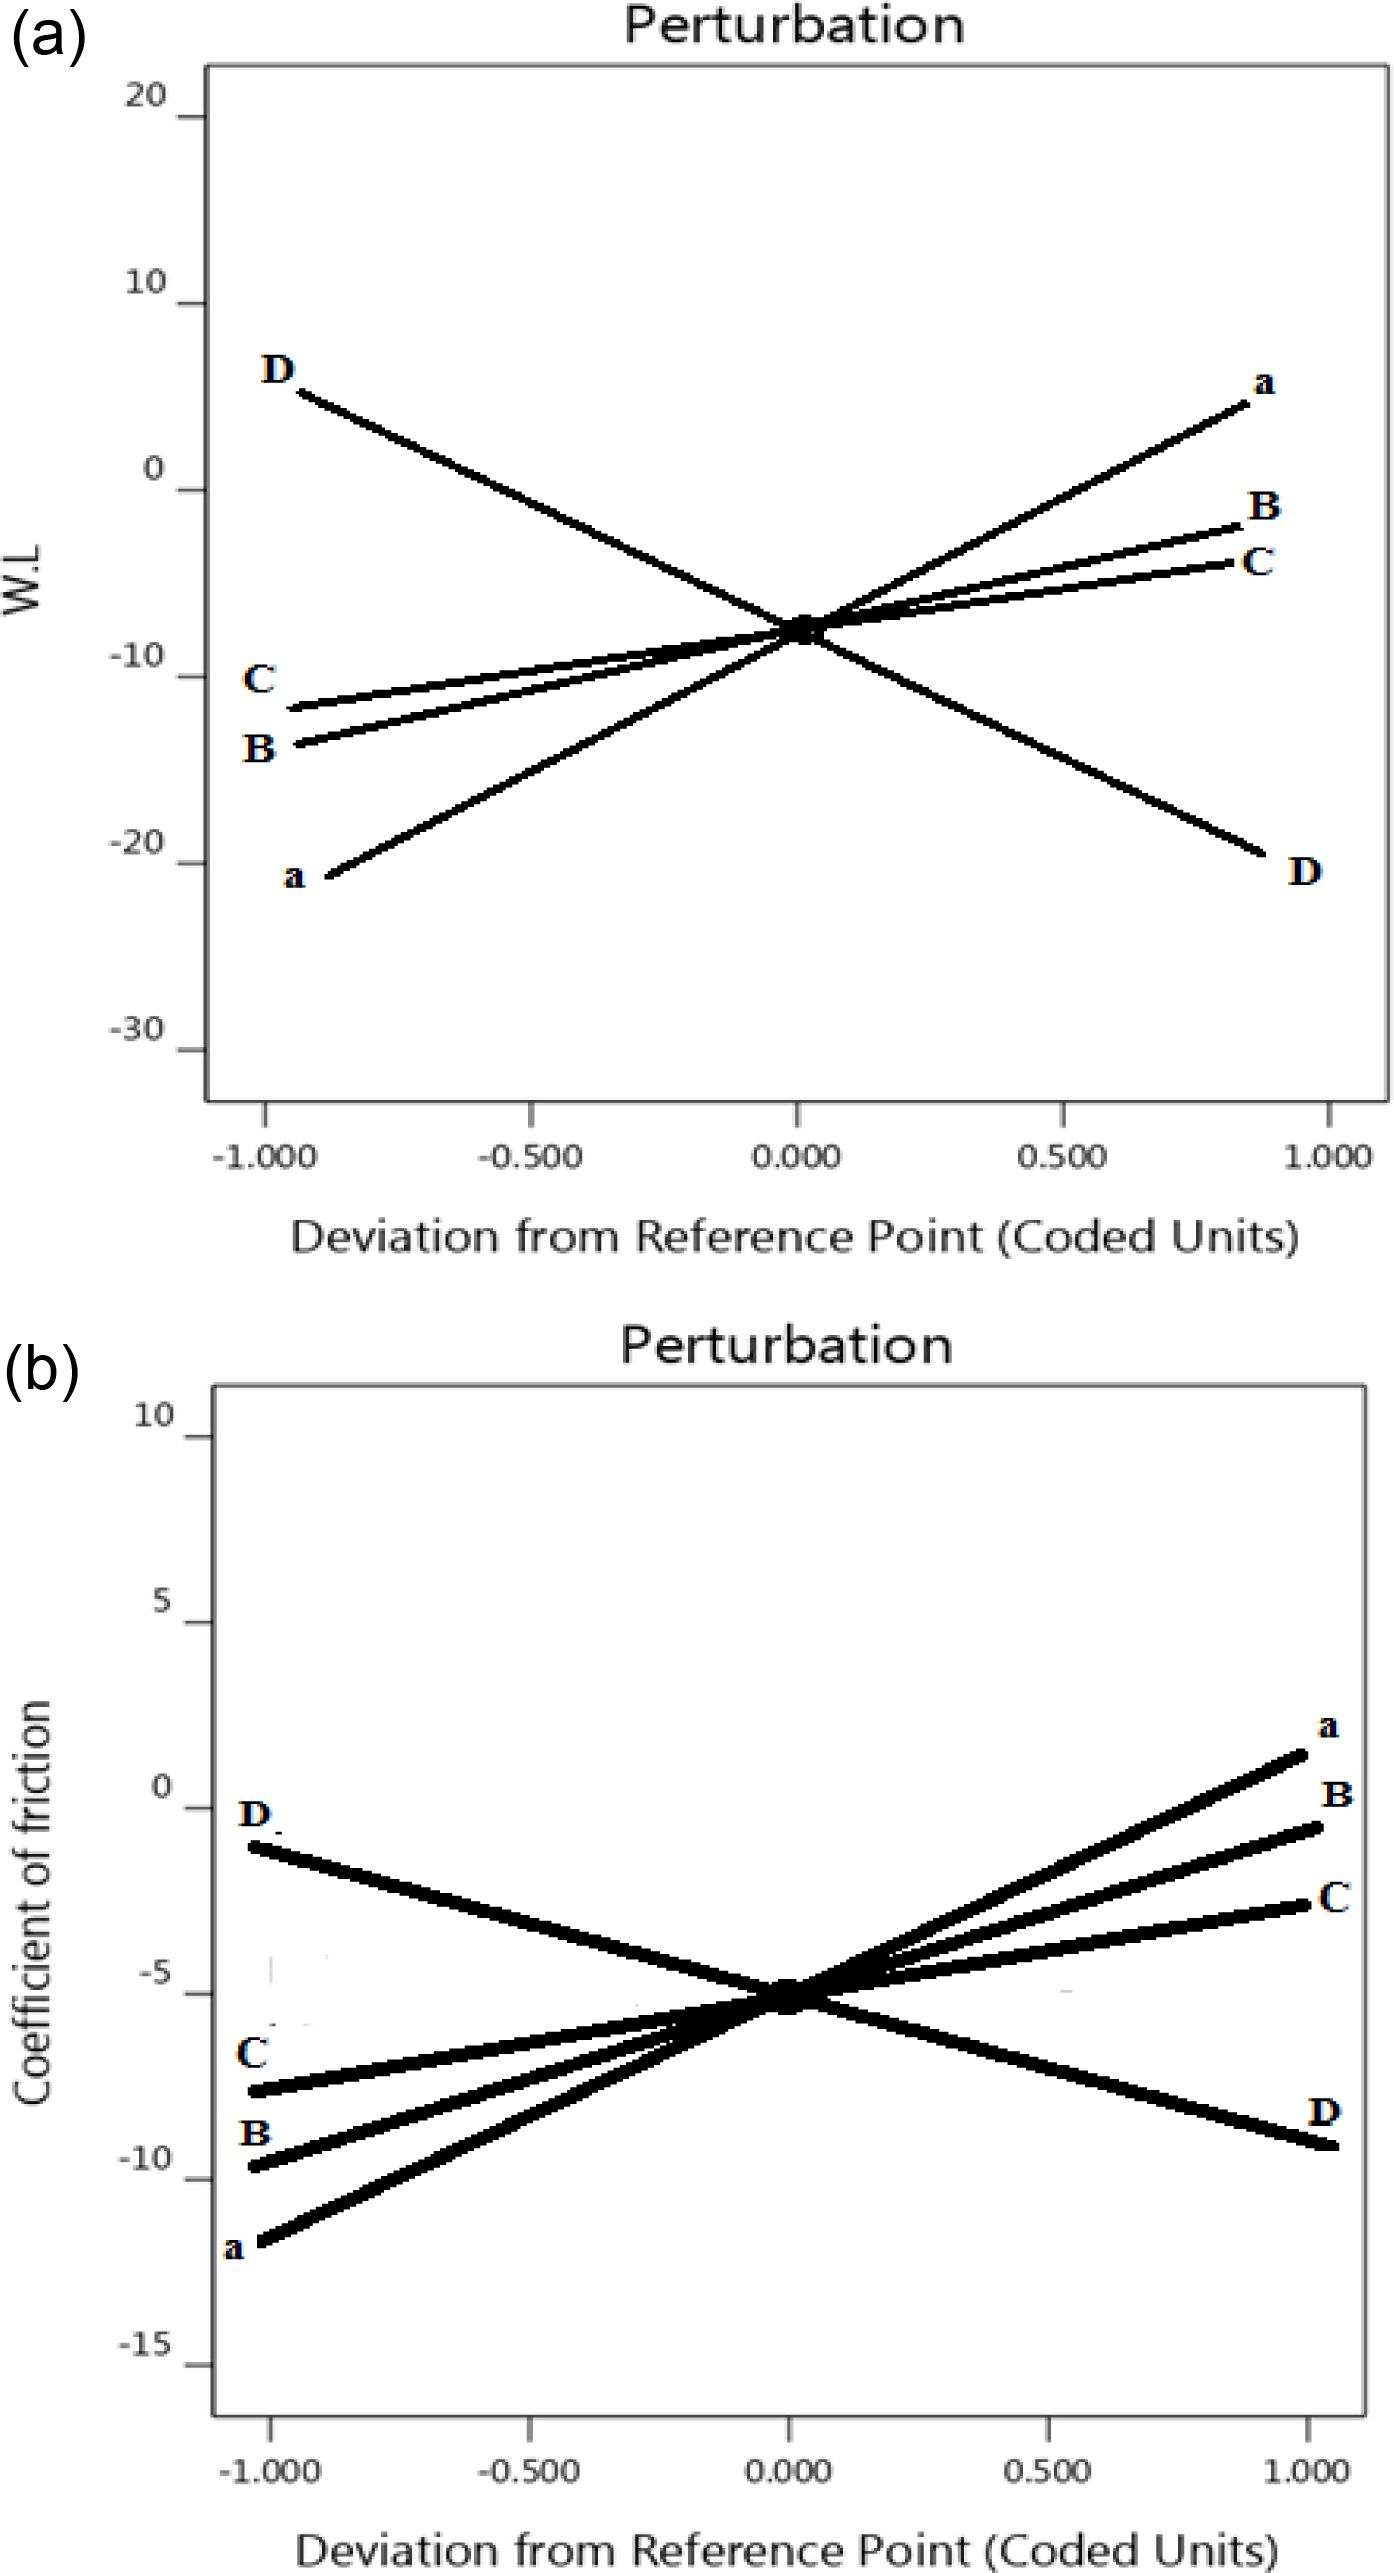
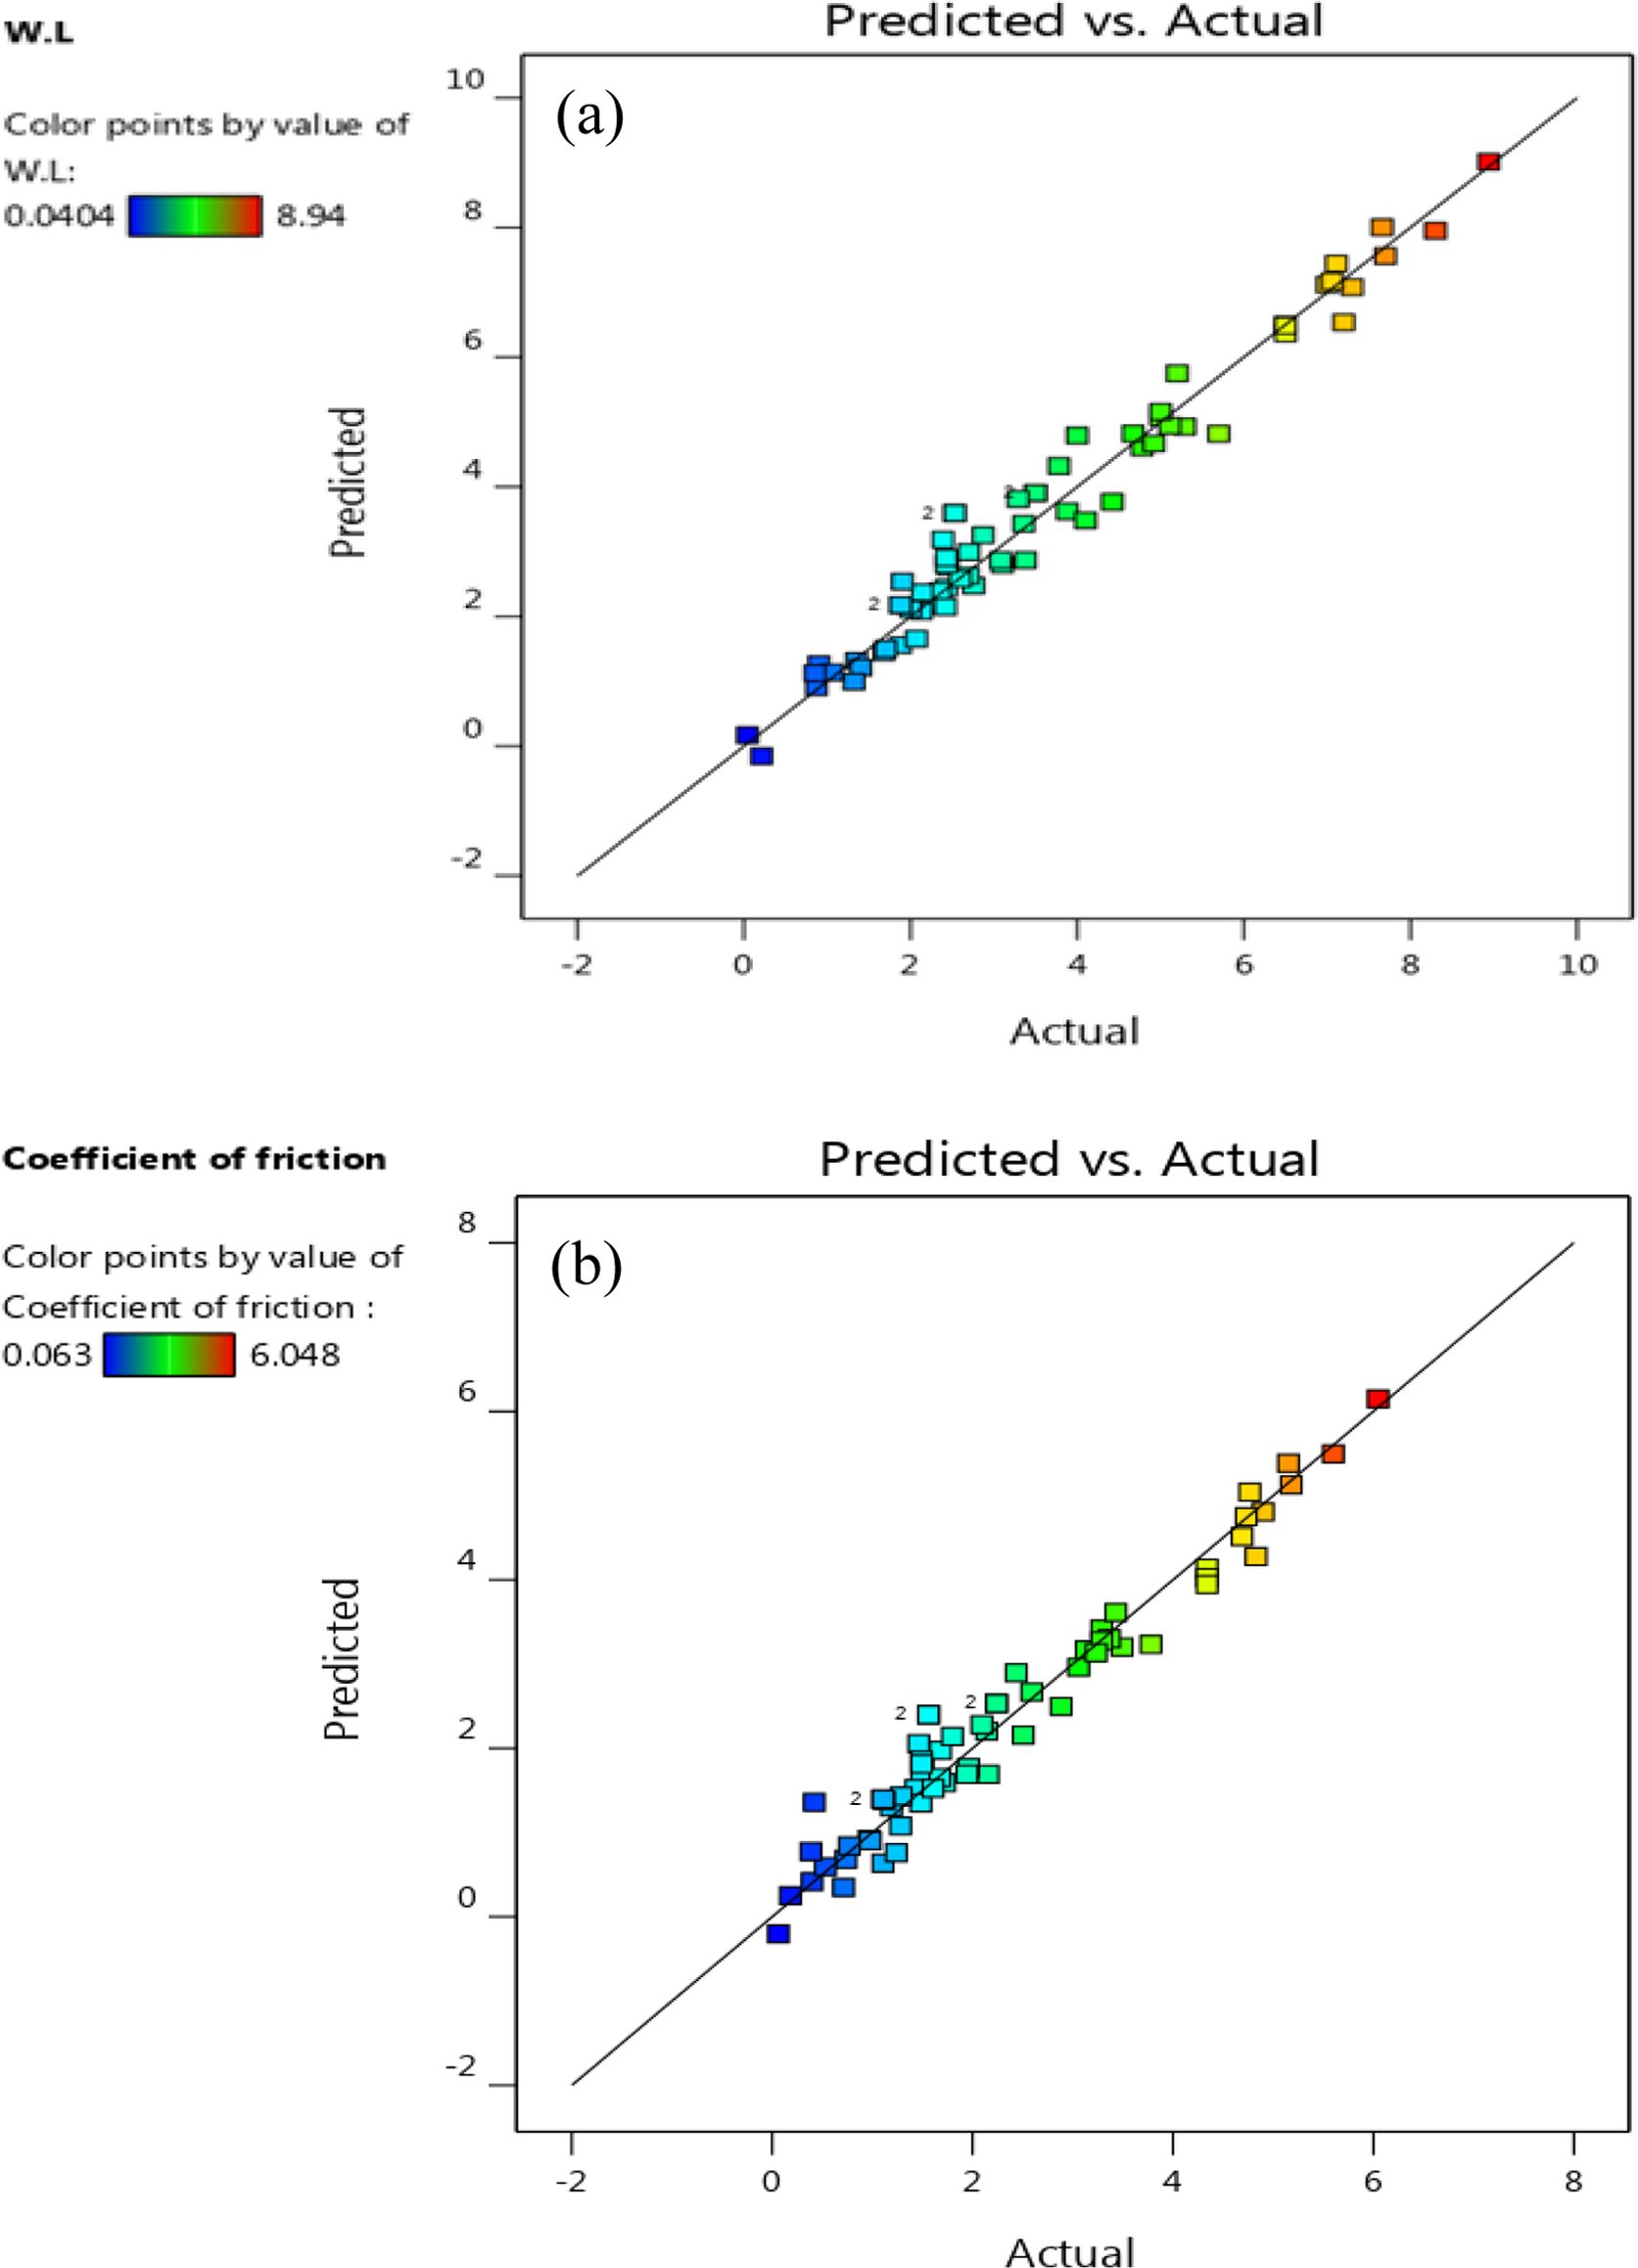
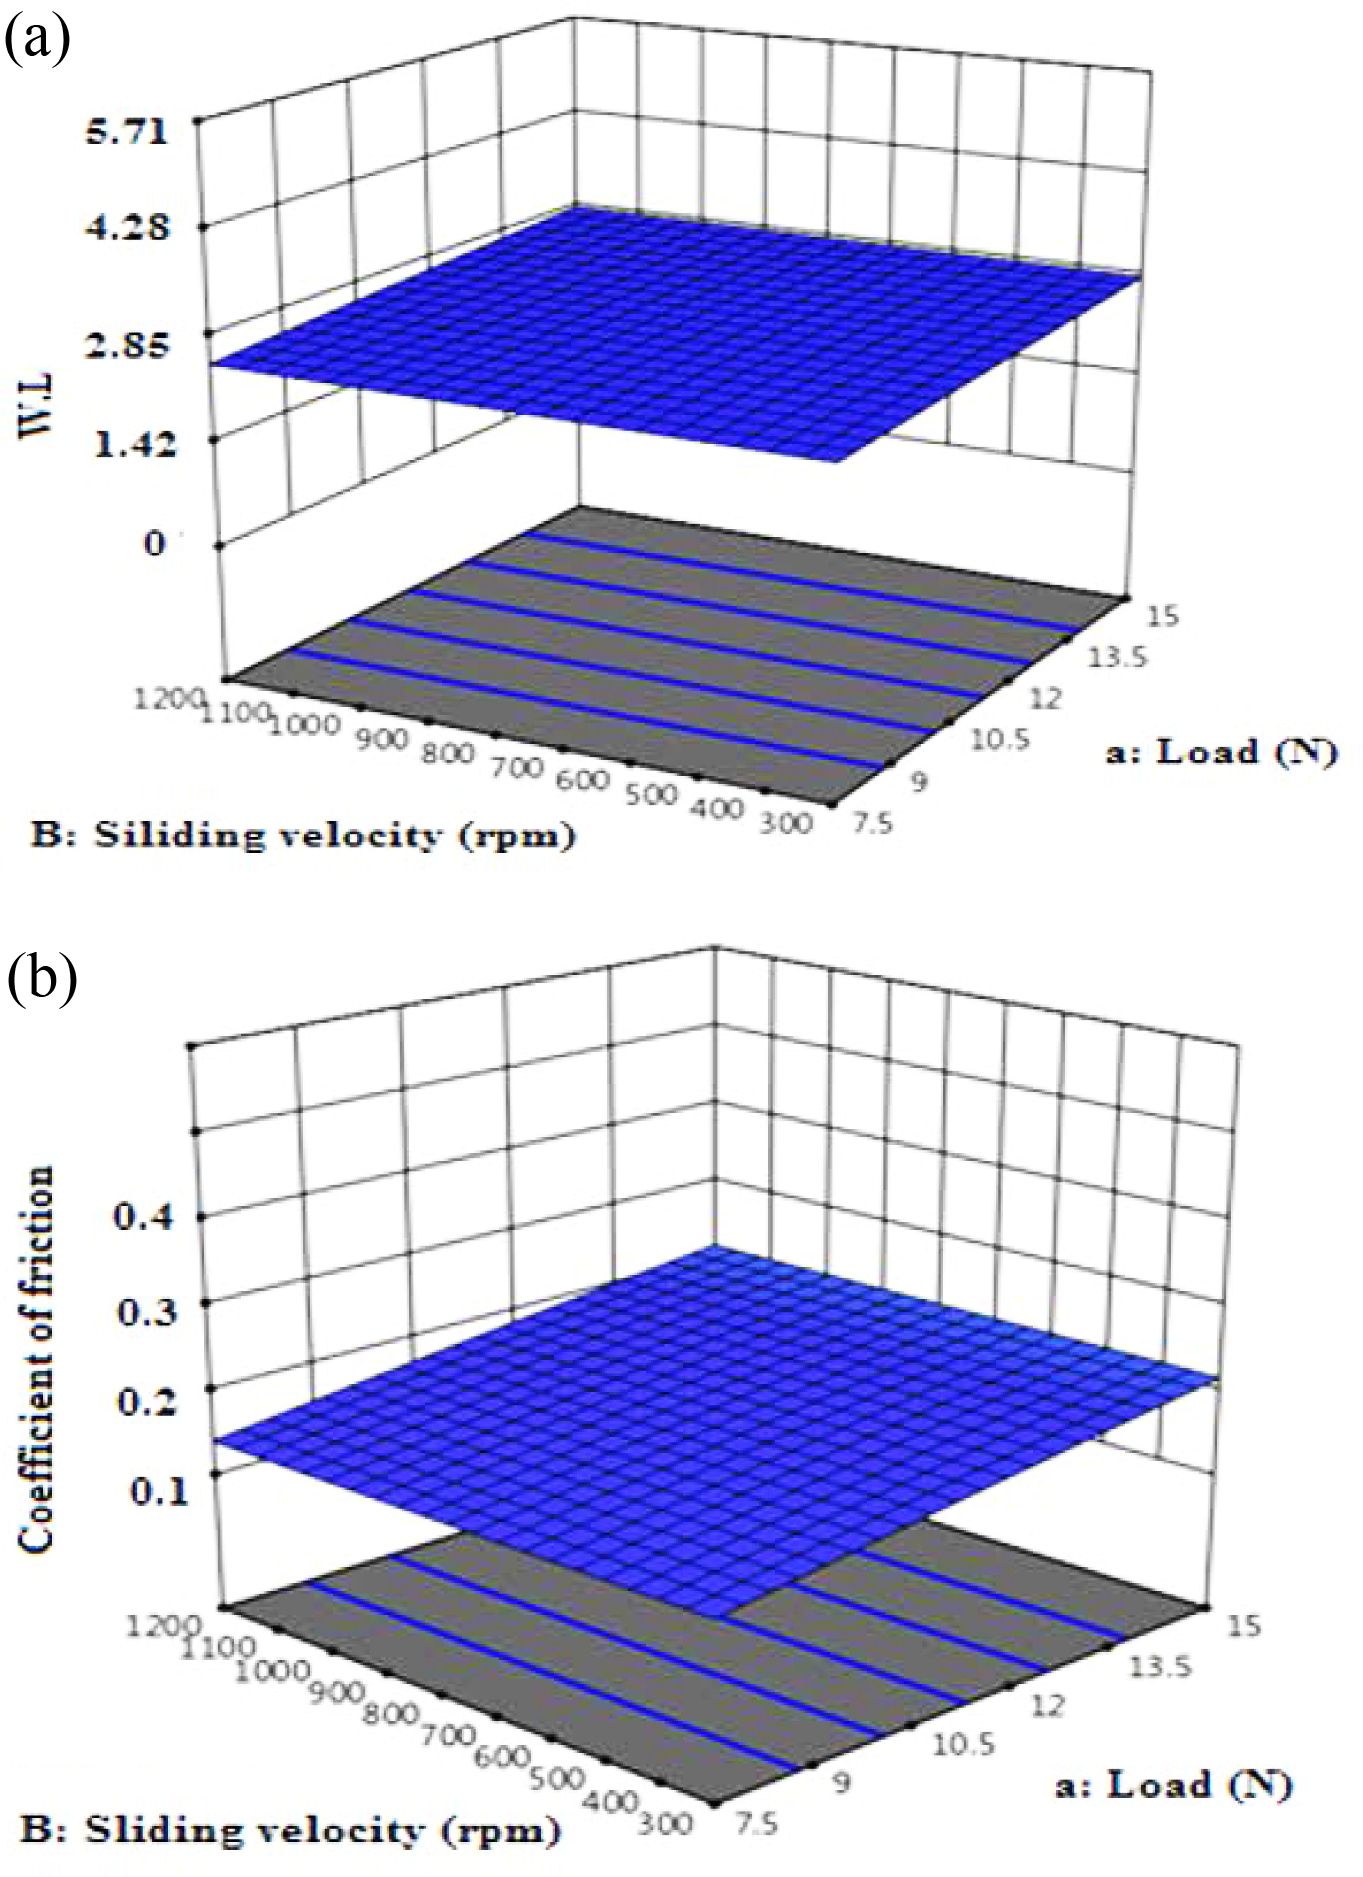
F-value magnitude can be used to order the influencing factors according to F-value. The highest value was obtained for D-type (9.22) followed by a-load (3.26) and B-sliding velocity (1.4) and C-temperature (0.0083), which reveals that the GNP wt% has greater effect on WL value than a-load, B-sliding velocity and C-temperature factors. Figure 5 presents the plot perturbation of the WL and friction coefficient data at mid values of the experimented process parameters. Perturbation plot used to study the effects of the four parameters at specific location inside the range of the design. In Figure 5(a), (b) the selected points ware in the central of design range (a=11.1 N, B=759, C=50.3 and D=0.4), X-axis showed the position of parameters level as a coded scale. It is clear from the figures that all factors have significant influence on the WL and coefficient friction values. On the otherward there are proportional effects for the parameters on the values of WL and coefficient friction, the plot shows that wt% of GNP has the maximum inverse proportion this due to the negative slope on the WL and coefficient friction. While load, sliding speed and temperature has a lower effect than wt% of GNP this due to positive slope of lines. In summary increasing the wt% of GNP leads to decrease WL and coefficient friction while the opposite can be obtained when sliding speed, applied load and temperature were increased. Figure 6 represents the variance of actual and predicted values; it is clear from the plot that there is a linear relationship between the actual and predicted values. The linear relationship referrers to that the model can provide a good fit for weight loss and friction coefficient. The interactive of all factors on coefficient of friction and on WL was represented in Figure 7 as a 3D contour. The contour represents combinations of the two factors that will predict a constant WL and coefficient of friction values. It is clear from the Figure 7 that GNP content decrease the WL and friction coefficient decreases. By using a combination of low load and low sliding speed, the lost WL and coefficient of friction values were founded, while holding wt% of GNP constant at 0.4. This is due to tribological performance of polymer composites is influenced by many parameters such as viscoelastic properties, normal load, sliding speed, and temperature.35 At high load, the reinforcement breakage possibility is increased,36 also at high-temperature polymer becomes softer, for this reason, the polymer may remove easily which increases wear rate.37 Increasing in load and speed generates heat leads to plastic deformation and changes polymer properties.38,39 High content of nanoparticles can produce a hard layer that works as surface protection at a friction state.
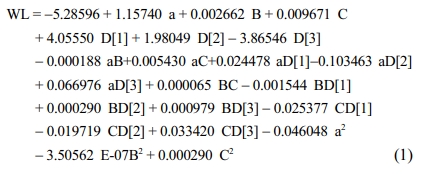
The resulting WL or the empirical models within the ranges of all parameters can be modeled by the eq. (1), and resulting friction coefficient within the ranges of all parameters can be modeled by the eq. (2):
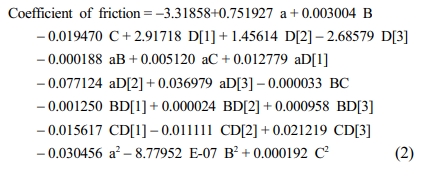
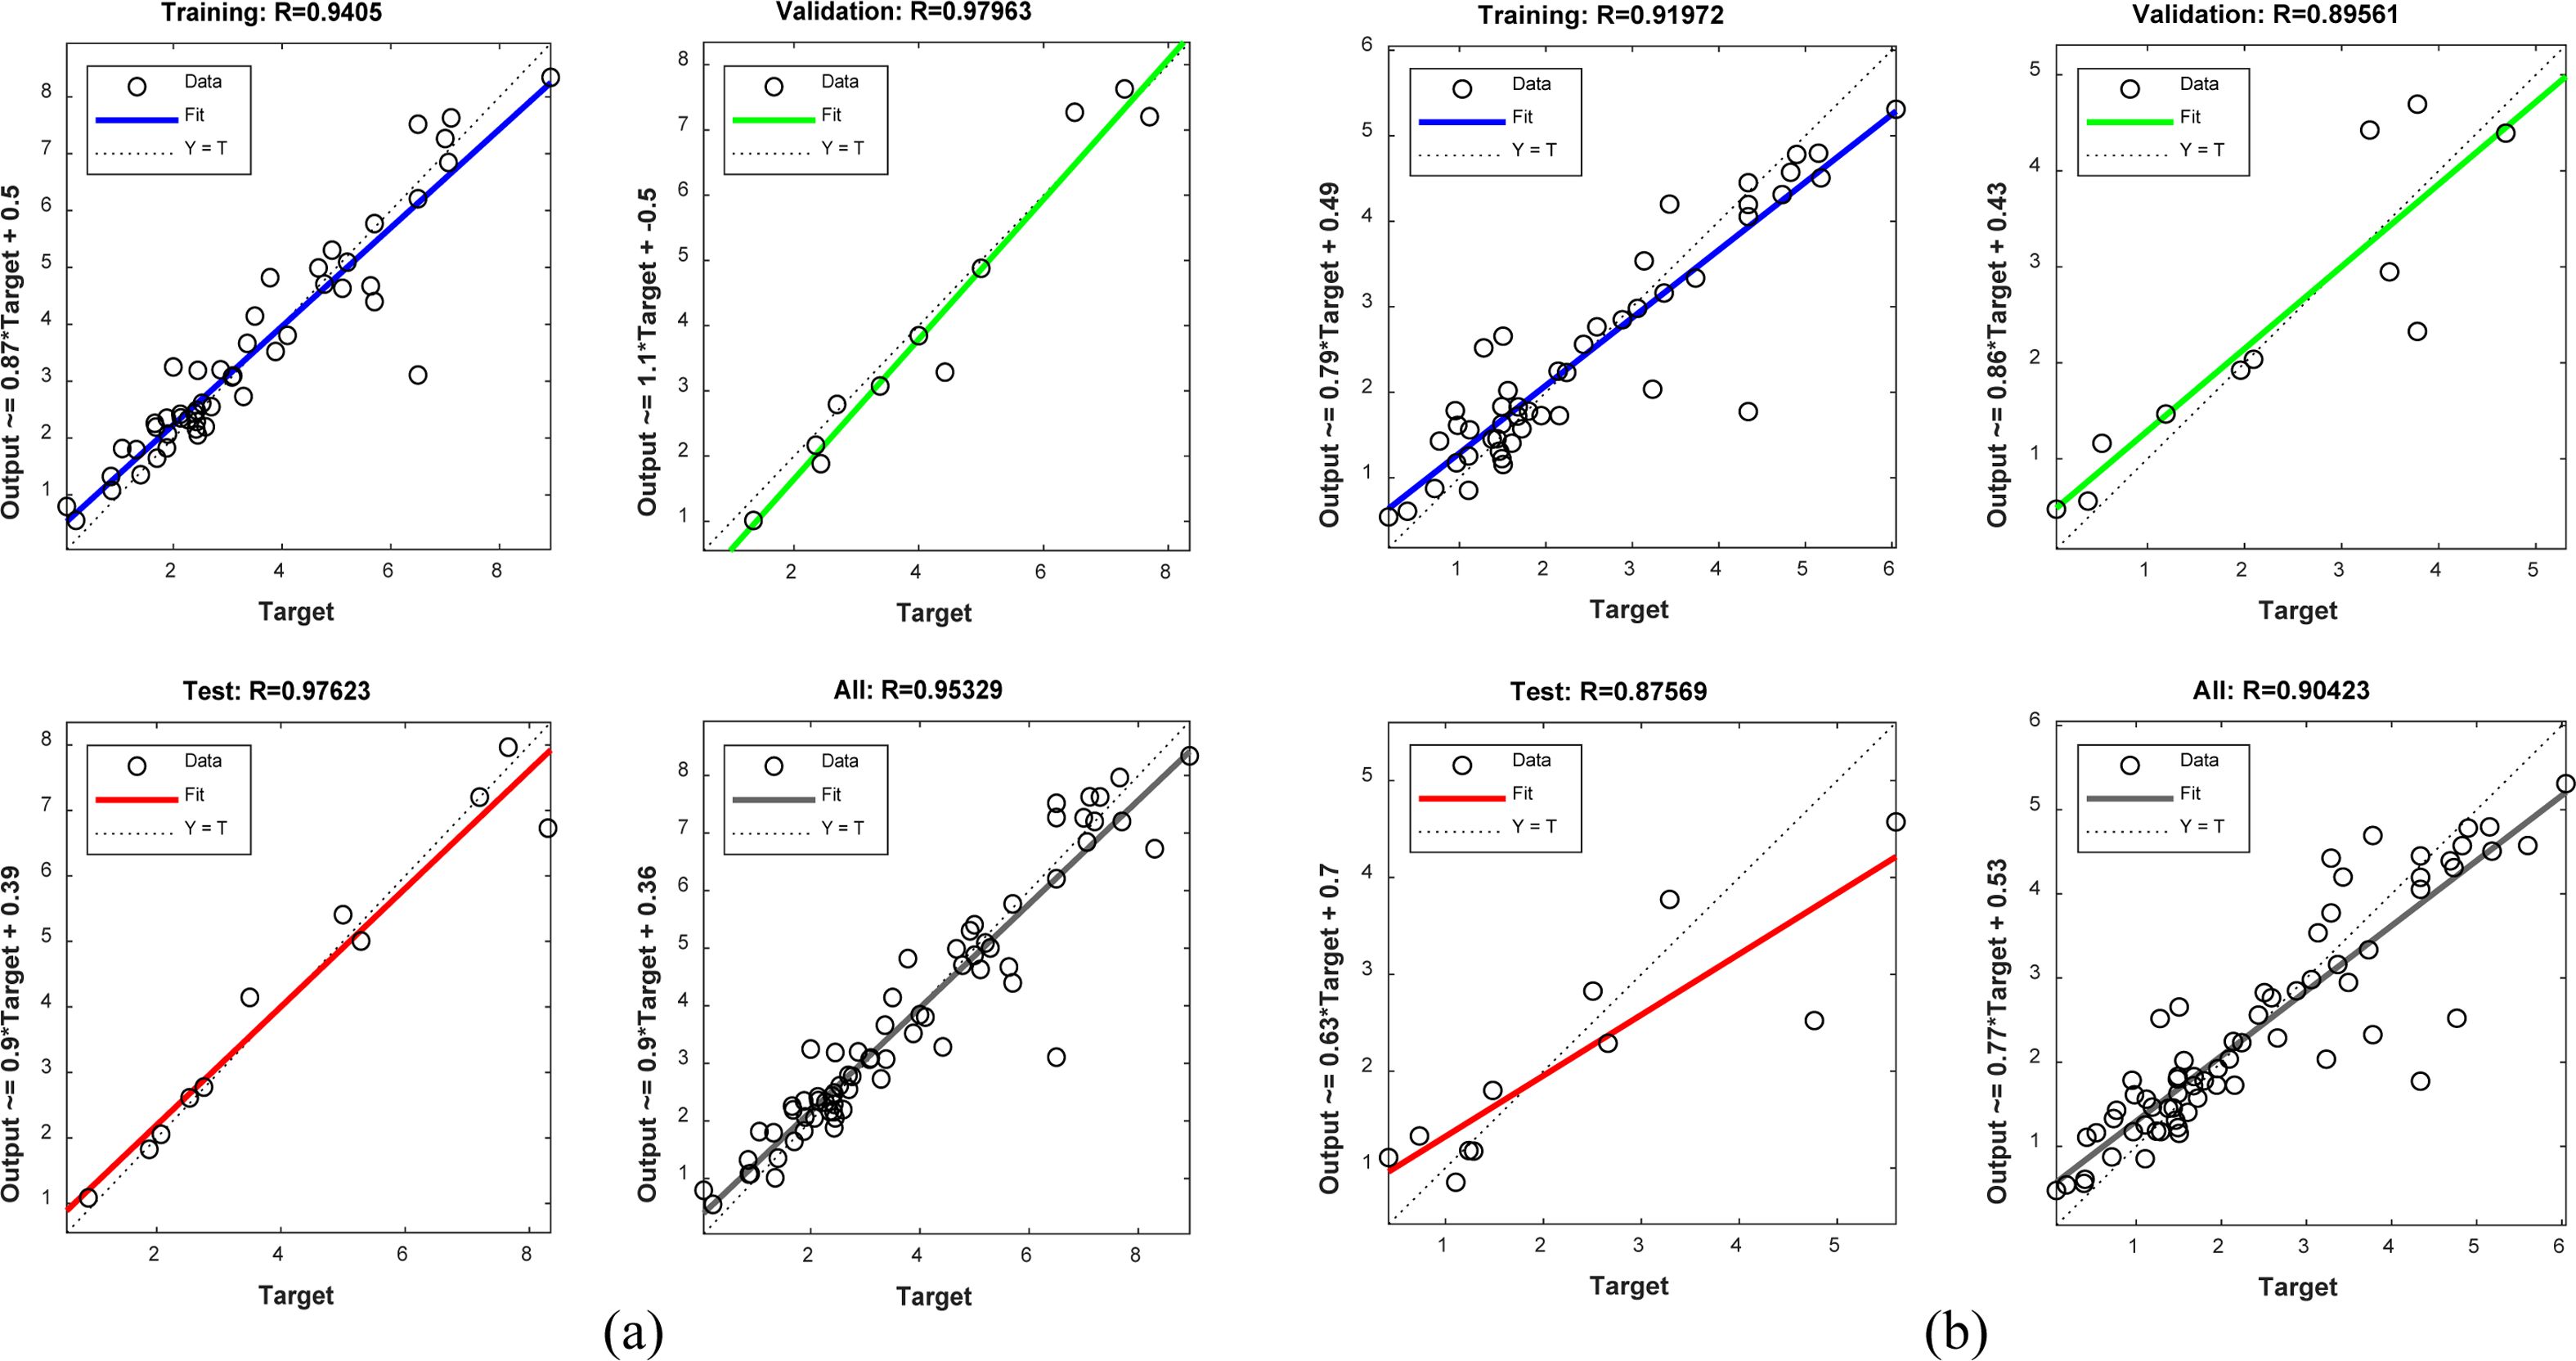
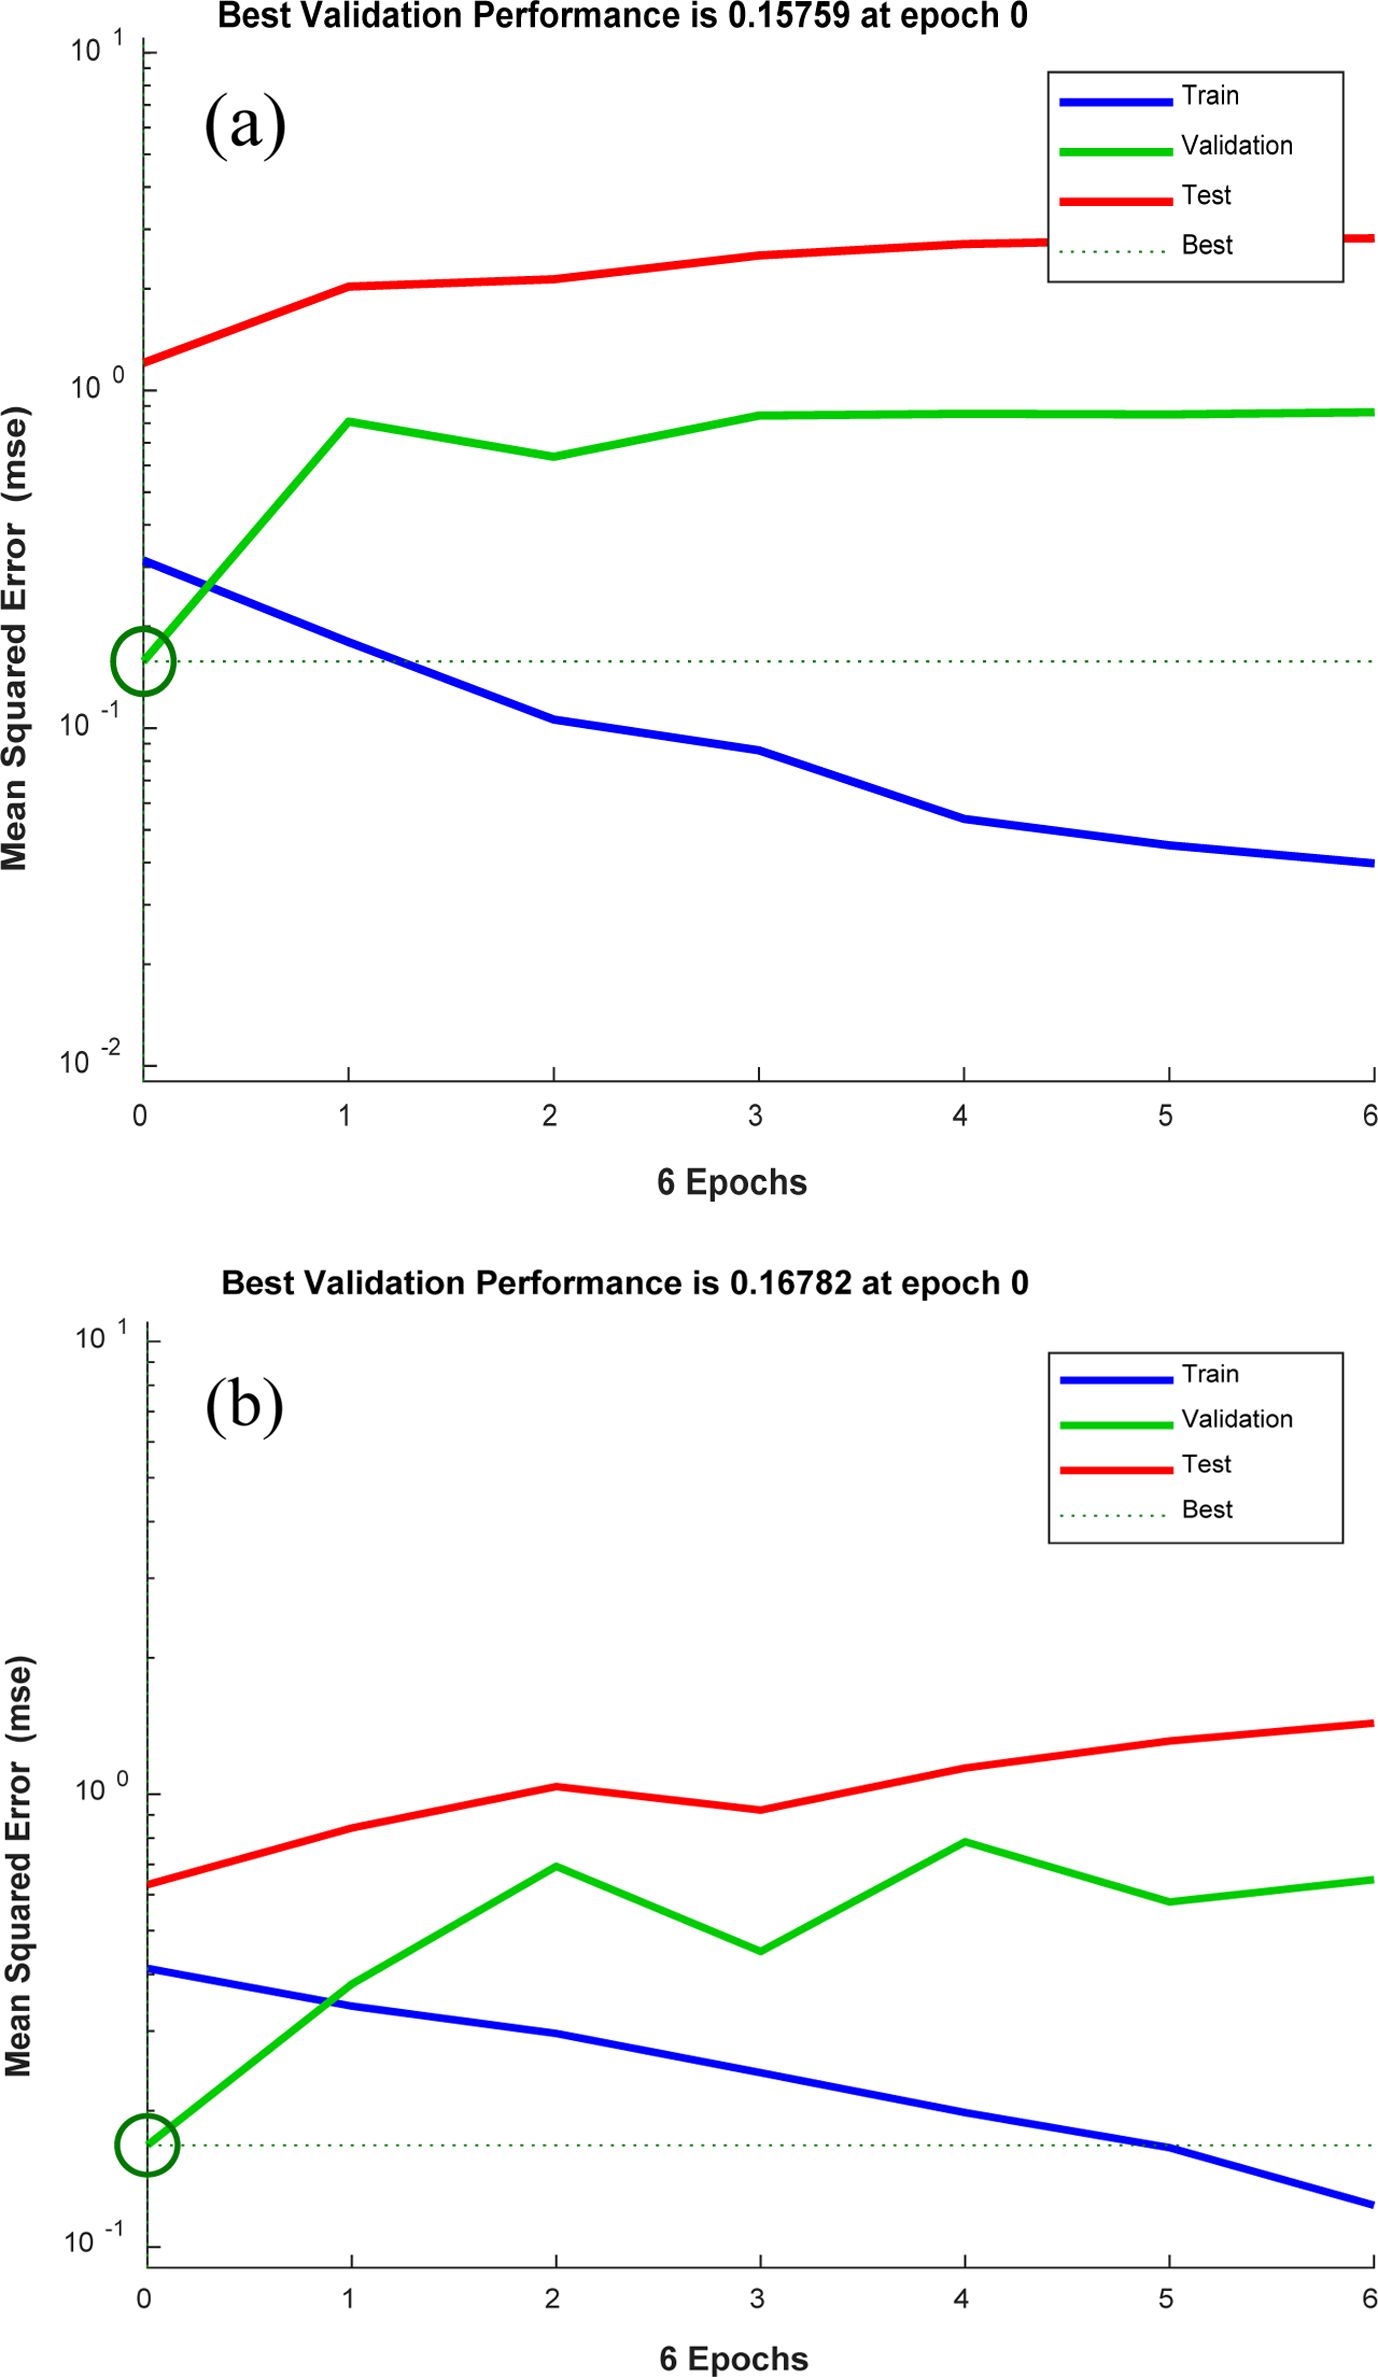
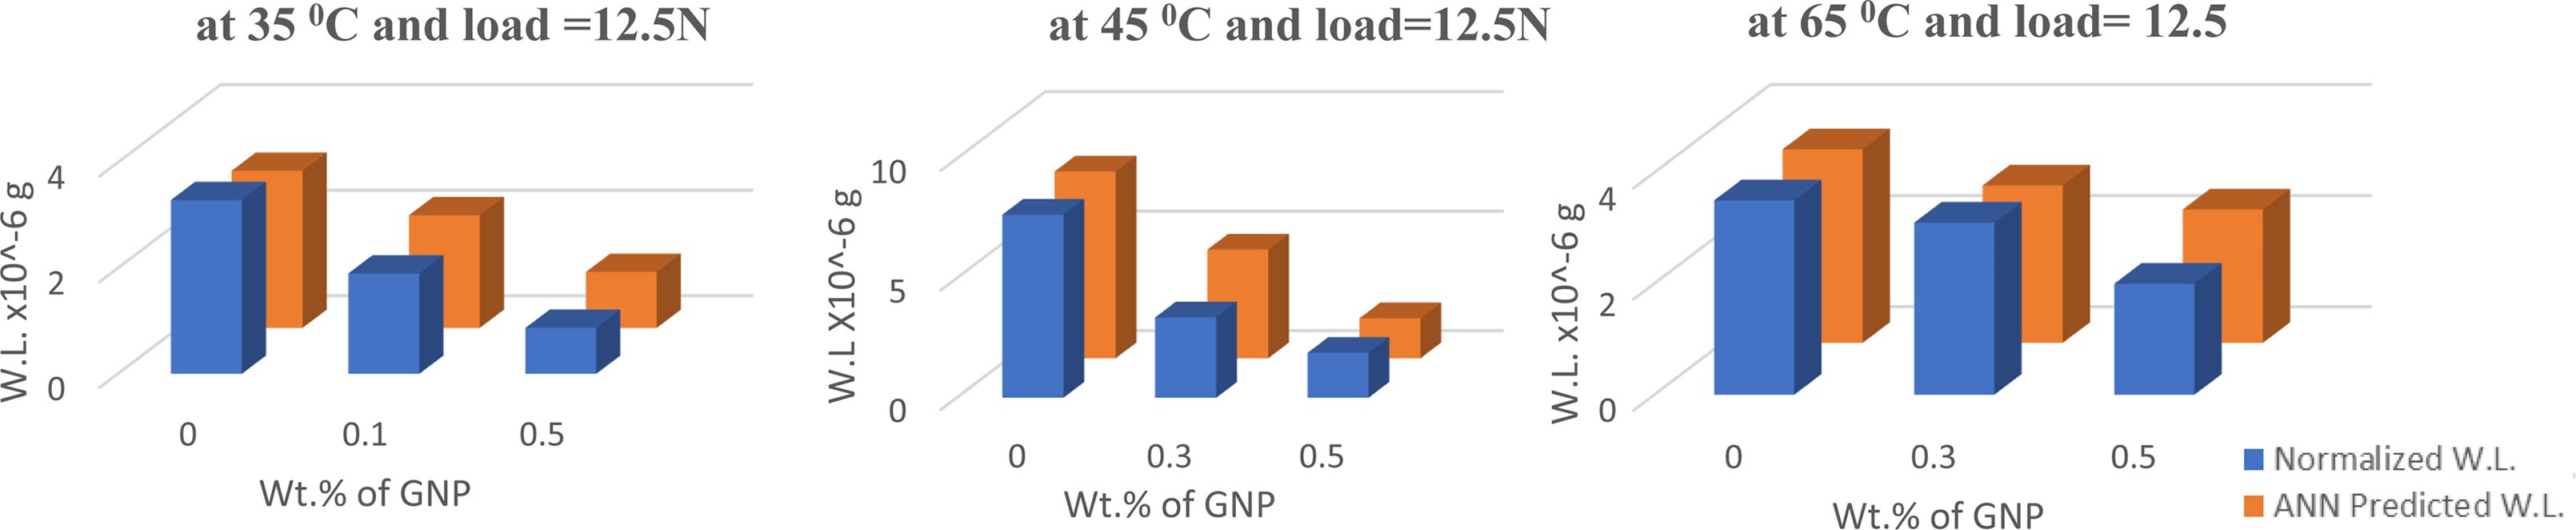
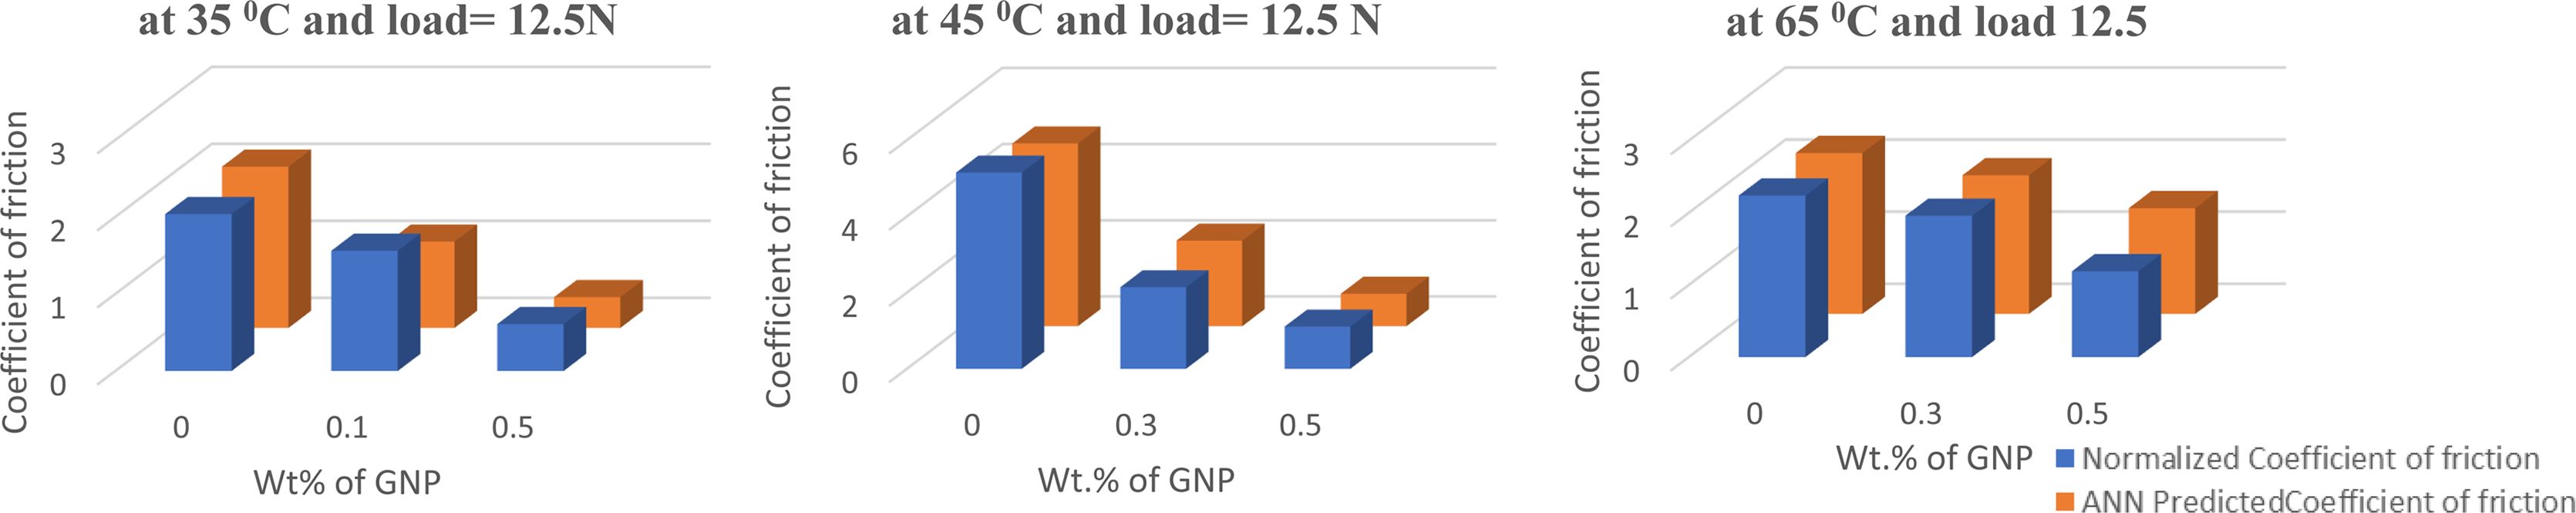
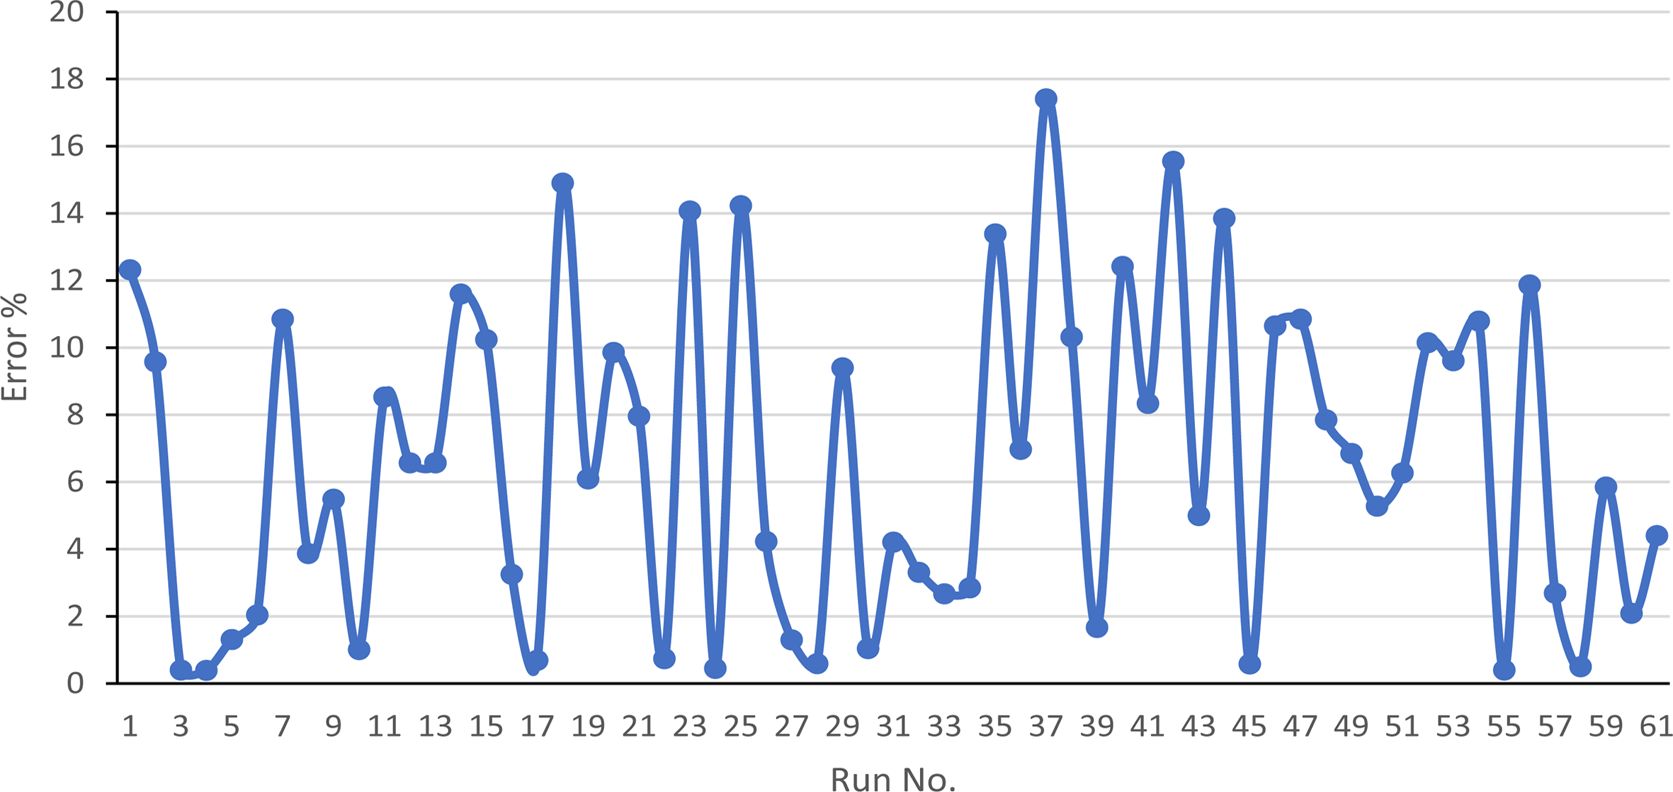
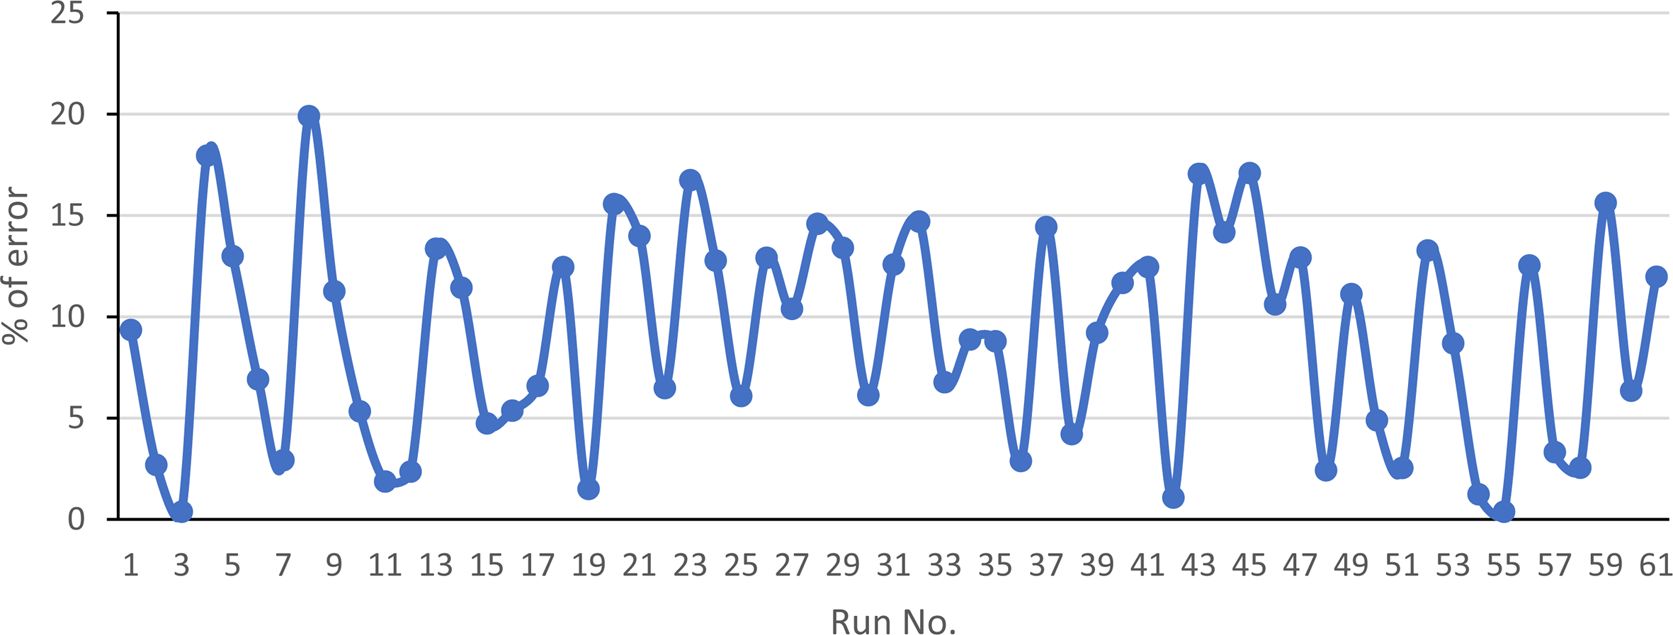
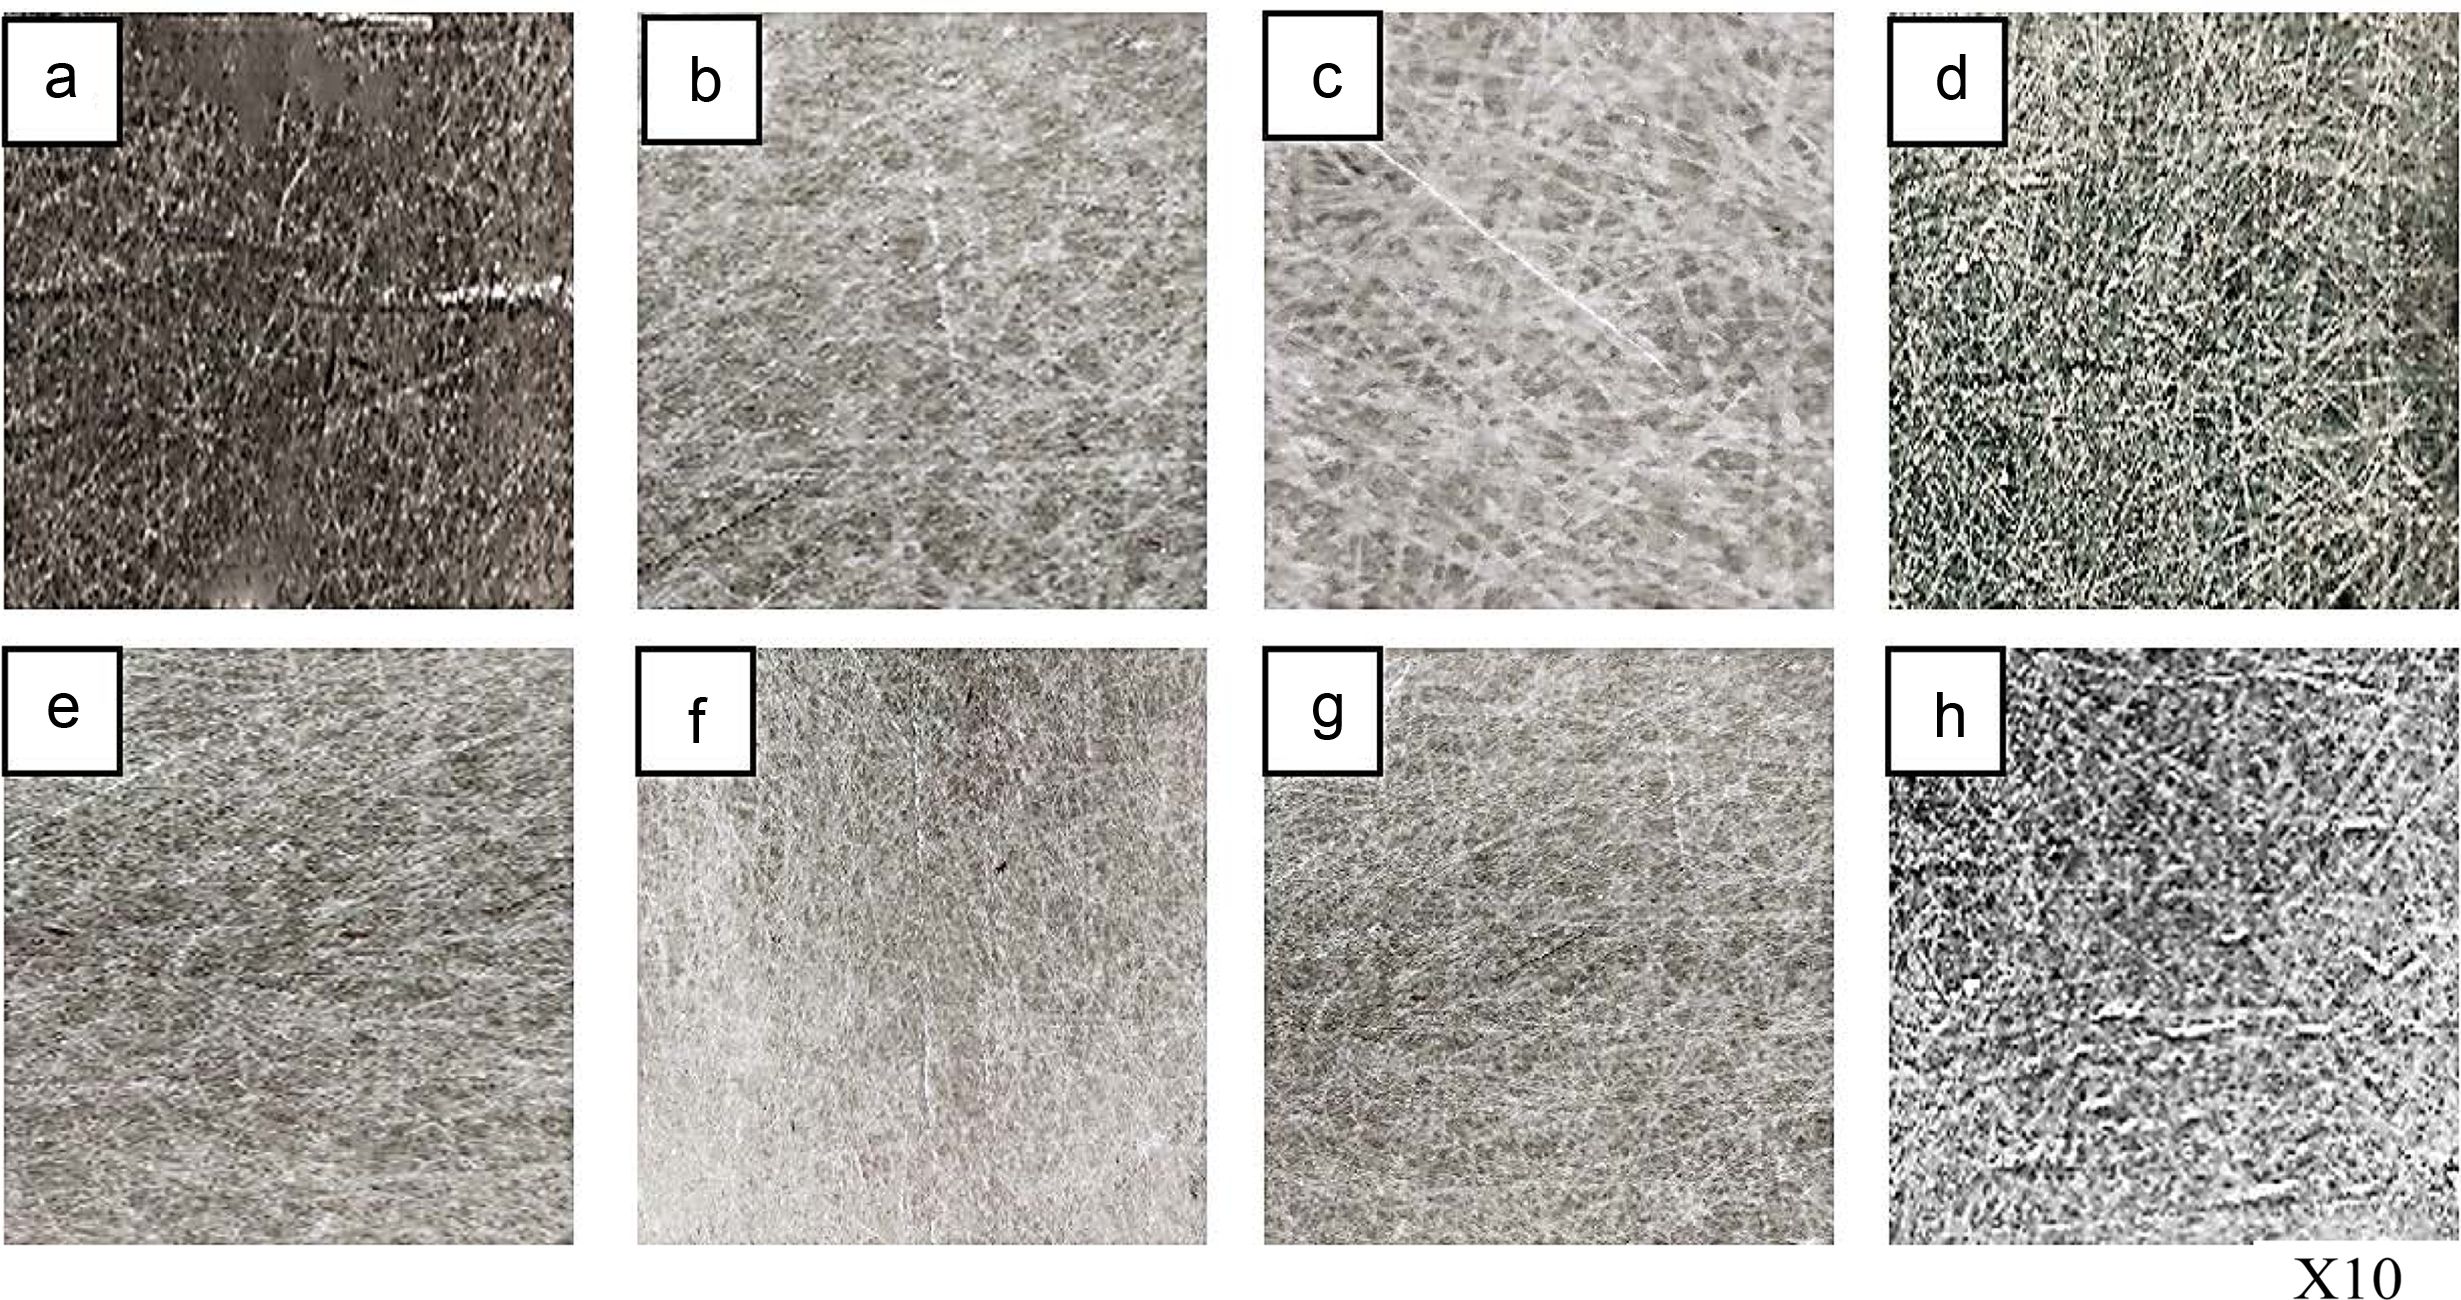
The ANN output and the target linear regression chart based on the Levenberg-Marquardt (LM) algorithms are shown in Figure 8. The figure reveals the superior relationship between the target and network output that is due to the correlation coefficients is 0.95329 for WL. The network performance plot developed based on the LM algorithm is illustrated in Figure 9. The good correlation found between normalized and predicted values reveals that RSM is able to produce accurate WL and friction coefficient predictions for the multilayers laminate nanocomposites under investigation conditions, and can be used confidently as a replacement source to generate the required data to train ANN model. Best validation performance values of WL are 0.15759×10⁻⁶ g which fund at the beginning of WL and 0.16782×10⁻⁶ g in case of the coefficient of friction. MSE between the experimental and ANN predicted results for WL is found to be 0.37×10⁻⁶ g and 0.41×10⁻⁶ g for friction coefficient results. Figures 10 and 11 show the relationship between normalized and predicted values of WL and coefficient friction values at some of selected runs. It is clear from the figure that the ANN prediction model success in predicting the values of both WL and friction coefficient. As observed in Figures 12 and 13, values of error % for the ANN prediction model did not exceed the 18% for the WL values and 20% for the coefficient of friction values. It is clear from optical microscope photos in Figure 14 for some of selected samples, that the outer layers resist the wear and fibres did not delamination from the matrix. This improvement is due to the role of reinforcement particles, which prevented the wear development and reduce the friction coefficient.40,41
|
Figure 5 Perturbation plot of the factors wt% of GNP, applied load, sliding speed and temperature on (a) WL; (b) coefficient of friction. |
|
Figure 6 Actual versus predicted data points: (a) WL; (b) coefficient of friction |
|
Figure 7 Relationship between all factors and (a) WL; (b) coefficient of friction |
|
Figure 8 Plot of regression based on LM algorithm: (a) WL; (b) coefficient of friction. |
|
Figure 9 Performance plot based on LM algorithm: (a) WL; (b) coefficient of friction. |
|
Figure 10 Comparison between normalized and predicted WL values at some selected runs. |
|
Figure 11 Comparison between normalized and predicted coefficient of friction values at some selected runs. |
|
Figure 12 Error % in WL between normalized and predicted values at each run |
|
Figure 13 Error % in coefficient of friction between normalized and predicted values at each run. |
|
Figure 14 Optical photo for the surface after wear test: (a) at T=35 oC, Rotation speed=300 RPM, Load=12.5 N and 0.1 wt% of GNP; (b) at T=55 oC, Rotation speed=900 RPM, Load=12.5 N and 0.5 wt% of GNP; (c) at T=55 oC, Rotation speed=900 RPM, Load=7.5 N and 0.5 wt% of GNP; (d) at T=65 oC, Rotation speed=1200 RPM, Load=7.5 N and 0 wt% of GNP; (e) at T=35 oC, Rotation speed=300 RPM, Load=10 N and 0.1 wt% of GNP; (f) at T=45 oC, Rotation speed=300 RPM, Load=10 N and 0.3 wt% of GNP; (g) at T=55 oC, Rotation speed=900 RPM, Load=12.5 N and 0.1 wt% of GNP; (h) at T=35 oC, Rotation speed=900 RPM, Load=12.5 N and 0.1 wt% of GNP. |
|
Table 3 Analysis of Variance (ANOVA) Summary for the WL and Coefficient of Friction |
In this work, the wear rate was tested for multilayer laminate nanocomposites by tribometer. Results showed that GNP can be improve the wear resistance and increase the friction coefficient. On the other hand, increasing value of applied load and sliding distance leads to increase the wear rate and decrease the friction coefficient. The minimum wear rate was obtained in the presence of GnP as reinforcement and at minimum load and temperature. Both RSM and ANN models were successfully created, these models can predict values for WL and friction coefficient with high accuracy. The optimum values to multilayers laminate nanocomposites according to the developed models were at temperature (35 °C), load (7.5 N), sliding speed (300 RPM), and wt% of GNP (0.3), at these values WL was 0.0404×10⁻⁶ g.
In the design space, the empirical models can be a predictive tool to represent the wear resistance performance of multilayers laminate nanocomposites in a short time and with low costs. Also, multilayers laminate nanocomposites can be used successfully in applications that need an excellent wear resistance.
- 1. Hutchings, I.; Gee, M.; Santner, E. Friction and Wear. In Springer Handbook of Materials Measurement Methods, 1st ed.; Czichos, H., Saito, T., Smith, L., Eds., Springer: Berlin/Heidelberg, 2006; pp 685-710.
-

- 2. Söffker, D.; Rothe, S. New Approaches for Supervision of Systems with Sliding Wear: Fundamental Problems and Experimental Results Using Different Approaches. Appl. Sci. 2017, 832-843.
-
- 3. Dziedzic, K.; Pashechko, M.; Barszcz, M.; Józwik, J. Structure and Construction Assessment of the Surface Layer of Hardfaced Coating after Friction. Adv. Sci. Technol. 2017, 11, 253-260.
-
- 4. Yu, J.; Zhai, D.; Hao, L.; Zhang, D.; Bai, L.; Cai, Z.; Yu, C. Cryptotanshinone Reverses Reproductive and Metabolic Disturbances in PCOS Model Rats via Regulating the Expression of CYP17 and AR. Evid. Based. Complement. Alternat. Med.2014, 670743.
-
- 5. Gualco, A.; Svoboda, H. G.; Surian, E. S. Study of Abrasive Wear Resistance of Fe-based Nanostructured Hardfacing. Wear 2016, 360-361, 14-20.
-
- 6. Mohammed, M. T. Nanocomposites in Total Hip Joint Replacements. In Applications of Nanocomposite Materials in Orthopedics, Inamuddin, Asiri, A. M., Mohammad, A., Eds. Elsevier: Amsterdam, 2019, pp 221-252.
-
- 7. Nuruzzaman, D. M.; Chowdhury, M. A. Friction and Wear of Polymer and Composites. In Composites and Their Properties, Hu, N., Ed.; IN TECH: Rijeka, 2012; pp 299-330.
-
- 8. Tabor, D. Friction and Wear-developments Over the Last Fifty Years. In Proceedings of International Conference on Tribology Friction, Lubrica-tion and Wear, 50 Years On; Institution of Mechanical Engineers: London, 1987; pp 157-172.
- 9. Wang, G.; Yu, D.; Kelkar, A. D.; Zhang, L. Electrospun Nanofiber: Emerging Reinforcing Filler in Polymer Matrix Composite Materials. Prog. Polym. Sci. 2017, 75, 73-107.
-
- 10. Liu, J.-C. Mechanical Performance of Cellulose Multilayer Laminate and Cellulose Nanocrystal Nanocomposite. Ph.D. Dissertation, Purdue University, West Lafayette, IN, 2014
- 11. Naskar, M. Polymer Nanocomposites for Structure and Construction Applications. In Properties and Applications of Polymer Nanocomposites; Tripathy, D. K., Sahoo, B. P., Eds.; Springer: Berlin, Heidelberg; 2017, pp 37-56.
- 12. El-Tayeb, N. S. M.; Mostafa, I. M. The Effect of Laminate Orientations on Friction and Wear Mechanisms of Glass Reinforced Polyester Composite. Wear 1996, 195, 186-191.
-
- 13. El-Tayeb, N. S.; Gadelrab, R. M. Friction and Wear Properties of E-glass Fiber Reinforced Epoxy Composites Under Different Sliding Contact Conditions. Wear 1996, 192, 112-117.
-
- 14. Bahadur, S.; Zheng, Y. Mechanical and Tribological Behavior of Polyester Reinforced with Short Glass Fibers. Wear. 1990, 137, 251-266.
-
- 15. Pihtili, H.; Tosun, N. Investigation of the Wear Behavior of a Glass Fiber-reinforced Composite and Plain Polyester Resin. Compos. Sci. Technol. 2002, 62, 367-370.
-
- 16. Rzatki, F. D.; Barboza, D. V. D.; Schroeder, R. M.; Barra, G. M. O.; Binder, C.; Klein, A. N.; de Mello, J. D. B. Effect of Temperature and Atmosphere on the Tribological Behavior of a Polyether Ether Ketone Composite. Friction 2015, 3, 259-265.
-
- 17. Parikh, H. H.; Gohil, P. P. Tribology of Fiber Reinforced Polymer Matrix Composites-A Review. J. Reinf. Plast Compos. 2015, 34, 1340-1346.
-
- 18. Schroeder, R.; Torres, F. W.; Binder, C.; Klein, A. N.; de Mello, J. D. B. Failure Mode in Sliding Wear of PEEK Based Composites. Wear 2013, 301, 717-726.
-
- 19. Sheiretov, T.; Van Gglabbeek, W.; Cusano, C. Evaluation of the Tribological Properties of Polyimide and Poly(amide-imide) Polymers in a Refrigerant Environment. Tribol. Trans. 1995, 38, 914-922.
-
- 20. Cannaday, M.; Polycarpou, A. Tribology of Unfilled and Filled Polymeric Surfaces in Refrigerant Environment for Compressor Applications. Tribol. Lett. 2005, 19, 249-226.
-
- 21. Demas, N. G.; Polycarpou, A. A. Tribological Performance of PTFE-based Coatings for Air-conditioning Compressors. Surf. Coat. Technol.2008, 203, 307-316.
-
- 22. Nunez, E. E.; Yeo, S. M.; Polychronopoulou, K.; Polycarpou, A. A. Tribological Study of High Bearing Blended Polymer-Based Coatings for Air-Conditioning and Refrigeration Compressors. Surf. Coat. Technol. 2011, 205, 2994-3005.
-
- 23. Solzak, T. A.; Polycarpou, A. A. Tribology of WC/C Coatings for Use in Oil-less Piston-type Compressors. Surf. Coat. Technol. 2006, 201, 4260-4265.
-
- 24. Kandanur, S. S.; Rafiee, M. A.; Yavari, F.; Schrameyer, M.; Yu, Z.-Z.; Blanchet, T. A.; Koratkar, N. Suppression of Wear in Graphene Polymer Composites. Carbon, 2012, 50, 3178-3183.
-
- 25. Bagheri, G. H.; Bonadonna, C.; Manzella, I.; Vonlanthen, P. On the Characterization of Size and Shape of Irregular Particles. Powder Technol. 2015, 270, 141-153.
-
- 26. Nassar, A.; Nassar, E. Effect of Fiber Orientation on the Mechanical Properties of Multi Layers Laminate Nanocomposites. Heliyon, 2020, 6,e03167.
-
- 27. Wu, L.; Wang, G.; Shen, T.; You, L.; Hu, W.; Si, C.-L. Optimizing Conditions for Antioxidant Phenolic Compound Extraction from Mahonia bealei (Fort.) Carr. Leaves Using a Response Surface Methodology. Hortic. Environ. Biotechnol. 2017, 58, 282-291.
-
- 28. Basheer, I. A.; Hajmeer, M. Artificial Neural Networks: Fundamentals, Computing, Design, and Application. J. Microbiol. Methods 2000, 24-31.
-
- 29. Abiodun, O. I.; Jantan, A.; Omolara, A. E.; Dada, K. V.; Mohamed, N. A.; Arshad, H. State-of-the-art in Artificial Neural Network Applications: A Survey. Heliyon 2018, 4, e00938.
-
- 30. Swingler, K. Applying Neural Networks: A Practical Guide. Academic: New York, 1996; pp 345-365.
- 31. Haykin, S. Neural Networks: A Comprehensive Foundation, 3rd ed. Pearson: Ontario, 1998; pp 76-84.
- 32. Fausett, L. Fundamentals of Neural Networks: Architectures, Algorithms, and Applications. Prentice-Hall, Inc.: Englewood Cliffs, 1994; pp 324-367.
- 33. Kevin, G. An Introduction to Neural Networks, UCL Press: London, 1997; pp 432-454.
- 34. Wang, Z.; Wang, B.; Liu, C.; Wang, W-W. Improved BP Neural Network Algorithm to Wind Power Forecast. J. Eng. 2017, 13, 940-943.
-
- 35. Tanaka, K. Transfer of Semi Crystalline Polymers Sliding Against Smooth Steel Surface. Wear 1982, 75, 183-199.
-
- 36. Shanmughasundaram, P. Effect of Temperature, Load and Sliding Velocity on the Wear Behavior of AA7075-SIC Composites. Mech. Mech. Eng. 2017, 21, 85-93.
- 37. Hossein, A.; McDonald, A.; Mertiny, P. Erosive and Abrasive Wear Resistance of Polyurethane Liners. In Aspects of Polyurethanes, Yilmaz, F., Ed.; IN TECH: Rijeka, 2017, pp 131-152.
-
- 38. Martínez, F. J.; Canales, M.; Bielsa, M. J.; Jiménez, M. A. Relationship between Wear Rate and Mechanical Fatigue in Sliding TPU-metal Contacts. Wear 2010, 268, 388-398.
-
- 39. Zafar, S.; Sharma, A. K. Abrasive and Erosive Wear Behavior of nanometric WC-12Co Microwave Clads. Wear 2016, 346-347, 29-45.
-
- 40. Ashraf, M. A.; Peng, W., Zare, Y.; Rhee, K. Y. Effects of Size and Aggregation/Agglomeration of Nanoparticles on the Interfacial/Interphase Properties and Tensile Strength of Polymer Nano- composites. Nanoscale Res. Lett. 2018, 13, 214.
-
- 41. Islam, M. S.; Masoodi, R.; Rostami, H. The Effect of Nanoparticles Percentage on Mechanical Behavior of Silica-Epoxy Nanocomposites. J. Nanosci. 2013, 2013, 275037.
-
- Polymer(Korea) 폴리머
- Frequency : Bimonthly(odd)
ISSN 0379-153X(Print)
ISSN 2234-8077(Online)
Abbr. Polym. Korea - 2023 Impact Factor : 0.4
- Indexed in SCIE
 This Article
-
2021; 45(5): 655-663
Published online Sep 25, 2021
- 10.7317/pk.2021.45.5.655
- Received on Oct 27, 2020
- Revised on May 14, 2021
- Accepted on Jun 7, 2021
Services
- Full Text PDF
- Abstract
- ToC
- Supporting Information
Introduction
Experimental
Results and Discussion
Conclusions
- References
Shared
Correspondence to
- Amal Ebrahim Nassar
-
Department of Mechanical Engineering, Higher Technological Institute, 10th of Ramadan City, Egypt
- E-mail: amal.nasser@hti.edu.eg
- ORCID:
0000-0002-4686-8134
Hyecheon Building(Room 601), #354, Gangnam-Daero, Gangnam-Gu, Seoul 06242, Korea
TEL : 82-2-568-3860, 561-5203, 569-3860 FAX : 82-2553-6938 E-mail: polymer@polymer.or.kr