


- Role of Reinforcement Materials on Mechanical and Tribological Properties of PTFE Composites
Yavuz Kaplan†

Department of Mechanical and Manufacturing, Pamukkale University, 20020, Turkey
- PTFE 복합재료의 기계적, 마찰 특성에 대한 강화재료의 역할
The use of
polytetrafluoroethylene (PTFE) in various industrial applications under extreme
operating conditions makes it very important to determine the behavior of this
material. The mechanical and wear properties of PTFE can be enhanced by adding
filler materials. This study focused on both the mechanical and tribological
properties of PTFE and its composites with a 25 wt% addition of carbon and
glass fiber (GF). Glass transition temperature (Tg),
hardness, tensile, and impact tests were carried out to determine the
mechanical and physical properties of PTFE. In addition, abrasive wear tests
were applied to obtain wear behavior. The tensile strength values of the pure
and C/GF-filled PTFE were found as 28, 16.7, and 18.6 MPa, respectively.
Tensile tests clearly showed that the filler materials led to a reduction of
the tensile strength and elongation at break of the PTFE. Impact energy values
were similarly decreased by the addition of filler materials. However, the
carbon and GF additions significantly increased the abrasive wear resistance
and Tg of the PTFE. Consequently, carbon and GF-filled PTFE
would be a suitable candidate for use in tribological applications/
The mechanical and wear properties of PTFE can be enhanced
by addition filler materials. Mechanical tests clearly showed that the carbon
and GF filler materials led to reduction of the mechanical properties. However,
its additions significantly increased the abrasive wear resistance of PTFE.
Keywords: polytetrafluoroethylene, carbon, glass fiber, wear behavior, mechanical properties
Polytetrafluoroethylene (PTFE) is an outstanding thermoplastic with
excellent mechanical properties e.g., good chemical resistance and
self-lubricating, low coefficient of friction and surface energy, high thermal
stability.1-3 Because of its outstanding mechanical properties, PTFE
is widely used as engineering plastic for many lubrication, anti-corrosion,
anti-stick, sealing, electrical, and medical applications4-6 and has
a significant effect in the development of manufacturing industry and in the
transportation, aerospace, and other industries.7-12
However, PTFE exhibits poor wear resistance, which leads to early failure
and leakage problems in sealing components. The mechanical and tribological
properties of PTFE can be significantly enhanced by the addition of suitable
filler materials.13-16 The most widely preferred fillers are carbon,
glass fibers, graphite, bronze and molybdenum disulfide (MoS2) in
different percentages to improve mechanical and tribological properties.
Fillers can be combined to achieve high wear resistance and mechanical
properties.17-21 Glass fiber (GF) is one of the most common fillers
for PTFE and it presents good wear resistance, low creep, good compressive
strength and excellent chemical compatibility.22,23 Carbon filler
leads to low deformation under load, good tribological properties and thermal
conductivity and low permeability.24,25 Graphite is a crystal
modification of high purity carbon. Its flaky structure imparts excellent
lubricity and increased wear resistance. Graphite can also be used with fillers
such as carbon and GF.26-28 Bronze provides excellent wear
resistance and thermal conductivity to PTFE. In addition, it can be combined
with MoS2 or graphite. Bronze-filled PTFE has poorer chemical
resistance than other filled PTFEs.26-29 MoS2 improves
wear resistance and further lowers the coefficient of friction and is typically
combined with other fillers such as glass and bronze.30,31
Generally, fillers can improve wear resistance by 10 to 500 times and increase
the thermal conductivity by 2 to 3 times.32-34
Teng et al. carried out tribological tests using stainless steel
plate as the counter body. They reported that the tribological and mechanical
properties of PTFE were improved dramatically by adding potassium titanate
whiskers and GF fillers.35 Zhang et al. analyzed the
influences of several tensile rates on the thermal and mechanical properties
and microstructure of GF-filled PTFE composites. The results showed that the
thermal stability of the composites would be slightly enhanced and the tensile
rate leads to improve the thermal expansion coefficient.36 Song et
al. researched the tribological behavior and PV limit of PTFE composites
reinforced with chopped carbon fiber, MoS2, and GF. They selected
the ASTM 1045 standard ring steel as the counterpart in the wear experiments.
The authors stated that the synergistic effect of MoS2 and GF led to
a great improvement in the tribological behavior and PV limit of the PTFE
composites.37 Huang et al. investigated GF-reinforced PTFE
sliding against duplex steel at an elevated temperature. They found that a high
wear rate was obtained during the direct contact of the PTFE and steel in the
run-in stage. After removal of the upper PTFE layer, the embedded glass fibers
became exposed and gradually came to move the main load. As a result, the wear
rate was significantly reduced.38 Bi et al. studied the
friction behavior of PTFE at a pin-to-plate interface. In the wear experiments,
PTFE was selected as the pin material and steel as the plate material. They
found that the pressure affected the coefficient of friction and changed the
deformed areas in the contact zone, and that the percentage of deformed zone
characters could be estimated based on equivalent strain energy.39
Previous studies have generally focused on either the mechanical
properties or the tribological properties of PTFE composites. There are few
studies in which both research fields are examined together. However, tribology
studies have been focused on improving the adhesive wear resistance of PTFE.
Researchers have carried out wear experiments using a metal disc as the
counterpart. This study compensates for the lack of studies in the literature
on GF- and carbon-reinforced PTFE. The aim was to determine the mechanical
properties and abrasive wear behavior of carbon-filled and GF-filled PTFE
composites.
Production
of Filled PTFE Composites. Carbon and GF were
purchased from local suppliers. The carbon, in the form of carbon black,
spherical-shaped particles (average 20 µm) was purchased from the
Polyplast Company. The glass fiber, in the form of chopped, (average diameter
of 15 µm and length of 500 µm) was supplied by Dost Chemistry Company. The
SEM images of filler materials were given in Figure 1. In addition, physical
properties of PTFE are given in Table 1.
The carbon and GF additives were added to the matrix at 25 wt% and
pre-mixed for 10 min at 180 rpm using a mechanical stirrer. The mixtures were
then dried at 100 °C for 2 h to remove moisture and other volatiles.
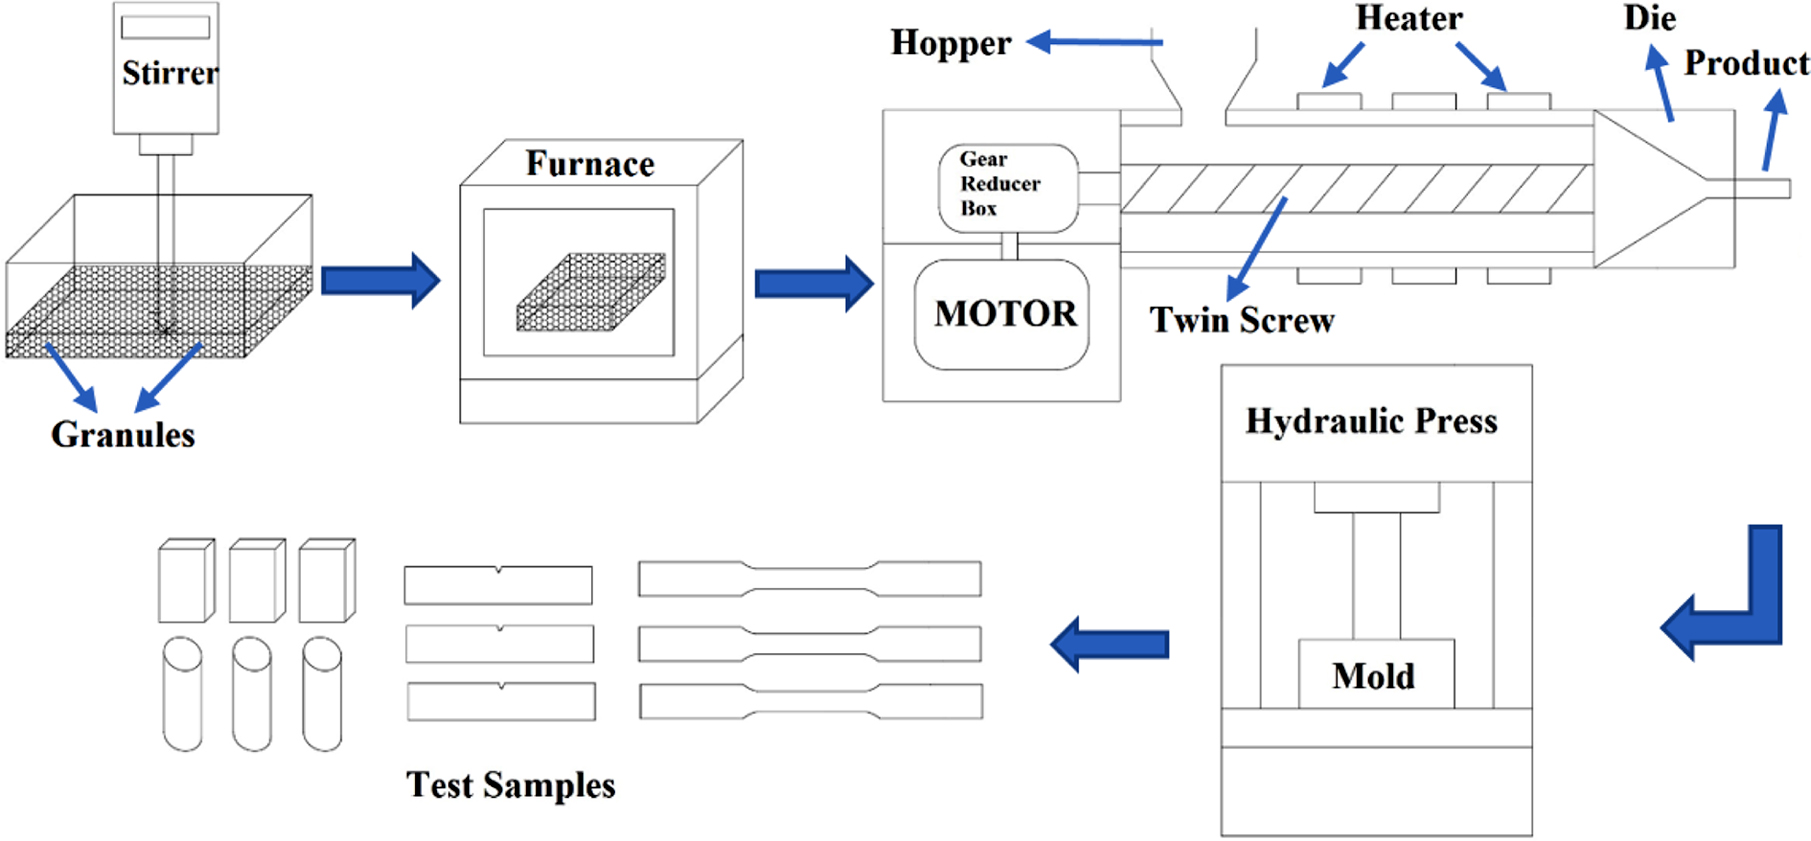
The pre-mixed products were transferred to the extruder. The carbon- and
GF-filled PTFE composites were fabricated by melt-blending with the twin screw
extruder at 30 rpm screw speed. The temperature from the feed zone to the
nozzle zone was 234-306-365-310 °C. The exit temperature was set at
40 °C. The extruded fibers were pelletized and press molding was used to produce
the test samples. A schematic illustration of the sample preparation is given
in Figure 2.
Determination
of Glass Transition Temperature. Glass transition
temperatures (Tg) of PTFE composites were measured on dynamic
mechanical analyzer in single cantilever bending mode. Samples were cubic with
a diameter of 16×10 ×4 mm. The temperature range, heating rate, and
frequency were 50 to 180 °C, 3 °C/min, and 1 Hz, respectively.
Hardness
Measurement and Wear Experiments of PTFE Composites. Shore D hardness
measurements were carried out at three different points for each sample in
accordance with ASTM standard D2240. The applied load was 50 N and the
hold time was 15 s.
The wear tests were performed in accordance with ASTM standard G99 using
a pin-on-disk apparatus under dry test conditions. PTFE sample in
Ø10×25 mm diameter was used as pin and a 200-grit abrasive paper with an
abrasive disc was used as counter-face during the wear test. The wear test was
carried out at 3 different distances of 120, 240, and 360 m under 3 different
loads of 5, 10, and 15 N at a speed of 2 m/s. The pin-on-disk test apparatus is
shown in Figure 3. The ultrasonic cleaner was used to clean contaminants on
surface of samples before measuring.
The applied load on the specimen was recorded during the wear test for
the calculation of the friction coefficient. The friction coefficient was
calculated using eq. (1).
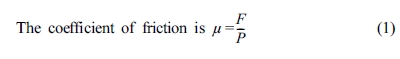
The frictional force and the normal load on the specimen are symbolized
by F and P, respectively. eq. (2) explains how to calculated
volume loss from the weight loss.
Tensile
and Izod Pendulum Impact Tests of PTFE Composites. Mechanical tests
have a vital role in the evaluation of the basic properties of materials, in
the development of new materials, and in quality and control of the products to
be used in industry. Tensile testing is the fundamental test for obtaining the
mechanical characteristic of a material and is widely preferred to acquire
basic design knowledge about the strength of materials. Moreover, it is an
acceptance test for the specification of materials.
An effective method to investigate the effect of filler materials on the
fracture behavior of PTFE is to subject this material to impact testing. The
Izod test is the one of the most common standards for impact testing. It is
very useful to deduce from fundamentals for fracture mechanics of a material.
Tensile and impact tests of the filled PTFE composites were carried out
in accordance with ASTM D638 and ASTM D256, respectively. Tensile and Izod
impact test specimens are given in Figure 4 and Figure 5, respectively.

|
Figure 1 SEM images of filler materials: (a) carbon; (b) glass fiber. |

|
Figure 2 Schematic illustration of PTFE sample production. |

|
Figure 3 Schematic view of wear test machine. |

|
Figure 4 Dimensions of tensile test specimen. |

|
Figure 5 Dimensions of impact test specimen. |

Microstructure
of Filled PTFE Composites. Figure 6 shows the
scanning electron microscopy (SEM) micrograph of the PTFE-based composites.
Surface images show the carbon (C) and GF used as reinforcing material. Upon
examining Figure 6(a), it can be seen that the energy dispersive X-ray
spectroscopy (EDS) analysis taken over the entire surface shows only C and
fluorine (F). In Figure 6(b), only F and silicon (Si) were determined. The
other peaks are the gold (Au) and palladium (Pd) from the coating applied for
SEM image acquisition. Thus, the EDS analysis and SEM images confirmed the
desired reinforcement of PTFE.
Hardness
Measurement. Hardness is one of the key parameters used for evaluation
of wear behavior.38 The effect of reinforcement materials on
hardness is given in Figure 7, which reveals that the GF and C filler materials
led to increased hardness of the PTFE. Pure PTFE had a Shore D hardness of 56,
whereas the GF reinforcement increased the hardness to 61 Shore D and the C
reinforcement increased the hardness to 65 Shore D.
Glass
Transition Temperature Properties of PTFE Composites. Figure 8 presents
tan δ- temperature curves for the pure PTFE and PTFE composites. Glass
transition temperature of pure PTFE was obtained as 129.4 °C. However, the
addition of filler materials on PTFE didn’t influence significantly on the Tg.
GF and C fillers lead to increase Tg only 1 °C and
2.5 °C, respectively. All samples displayed fairly sharp and well-defined
glass transition temperature relaxation. Moreover, Figure 8 compares the values
of tan δ of the pure PTFE and PTFE composites. The results show that the PTFE
composites possessed higher tan δ values compared to pure PTFE. The higher
value of tan δ means higher energy damping behavior or lower elasticity. This
reduction in carbon and GF filled PTFE´ elasticity (increase in tan δ) can be
ascribed to the role of filler materials. Carbon and GF lead to restrict the
energy storage ability of PTFE.
Tribological
Properties of PTFE Composites. Figures 9 and 10
show the results of the wear tests for the pure PTFE and PTFE composites with
25 wt% added contents of C and GF tested against the abrasive paper. There
is a clear reduction in wear volume for the PTFE composites compared to the pure
PTFE, although it appears only slightly dependent on the reinforcement
materials that were used in the experiments. However, it is clearly seen in Figures 9 and 10 that the reinforcement materials improved the
abrasion resistance of the PTFE. In the case of the composites, for a given
25 wt% C and GF, the specific wear rate decreased sharply with increasing
sliding distance. Furthermore, the sliding distance and applied load
significantly influenced the volume loss. The volume loss increased with increasing
sliding distance and applied load. Applied load and sliding distance define wear
mechanisms.40-44 Contact time between the wear surfaces was increased with
increasing sliding distance. Therefore, higher volume loss was obtained with
higher sliding distance. In the adhesive wear tests that were carried out with
a metal disc as the counterpart, the C reinforcement improved the wear
resistance of PTFE more than the GF reinforcement.14,24,25 However,
when tests were carried out with abrasive paper, no significant difference in
effect was found between the C and GF reinforcements.
The variation in the CoF according to the sliding distance under a
constant load for pure PTFE and GF- and C-filled PTFE is described in Figure
11. The average friction coefficient of pure PTFE was about 0.22, which is
obviously less than that of the C-filled PTFE, and was very close to that of
the GF-filled PTFE. Nevertheless, the friction coefficient of the G-filled PTFE
increased slightly during the friction process, which had obvious fluctuations,
with an average value of about 0.2, whereas, for the pure and C-filled PTFE,
the friction coefficient curve was typically flat and smooth. Consequently, C
reinforcement increased the friction coefficient of PTFE, while GF reinforcement
decreased it.
Figure 12 shows SEM images of the worn surfaces of pure PTFE and PTFE
composites with C and GF contents of 25 wt%. As seen in Figure 12(a), the
worn surface of the pure PTFE shows a pattern of scratched and flaked-off
matrix material. Moreover, wear debris appears on the worn surface of the PTFE.
Figure 12(b) shows the worn surface of the 25 wt% C-filled PTFE, which
exhibits exposed carbon fillers and short, criss-crossed cracks caused by the
peeling of the PTFE matrix. Where the cracks are expanded, the fillers exposed
to the counterface were finally removed, as shown in Figure 10(b). The exposed
carbon fillers acted as hard particles and reduced the counterface contact
area; thus, the volume loss of the C-filled PTFE decreased significantly. As
shown in Figure 12(c), the worn surface of the 25 wt% GF-filled PTFE was
smoother than that of the C-filled PTFE. The SEM image shows exposed GF on the
worn surface. The exposed GF led to the reduction of the contact area and
friction coefficient. The resistance of the composite to plowing was improved,
as the composite hardness increased with the GF reinforcement, which also
contributed to the decrease in the friction coefficient and wear rate of the
GF-filled PTFE. Similarly, the sloughed GFs also acted as needle roller
bearings to further reduce the volume loss. The wear experiment results showed
that the usage of reinforcement materials enable to use polymers in
tribological applications.45-47
Tensile
and Impact Properties of PTFE Composites. Figure 13 presents
the results of the tensile tests for the pure PTFE and PTFE composites with C
and GF contents of 25 wt%. The tensile strength values of the pure and
C-/GF-filled PTFE were obtained as 28, 16.7 and 18.6 MPa, respectively.
Tensile tests clearly showed that the filled materials led to reduction of the
tensile strength of the PTFE. Likewise, the filler materials also caused a
reduction in the elongation of the pure PTFE. It was noted that pure PTFE
showed the highest tensile strength and the highest elongation values.
The Izod impact test results of the PTFE and PTFE composites are given in
Figure 14. Impact energy values of the pure and the C-/GF-filled PTFE were
obtained as 16.5, 8.5 and 13.5 kJ/m2, respectively. The use of
filler materials within the PTFE served to reduce the impact energy. In
particular, the carbon filler reduced impact energy significantly.
Consequently, Filler materials led to reduction of mechanical properties of
PTFE unlike other polymers.48-50

|
Figure 6 Microstructure and EDS analysis of filled PTFE: (a) C-filled; (b) GF-filled. |

|
Figure 7 Hardness values of filled PTFE composites. |

|
Figure 8 Glass transition temperature curves of PTFE composites. |

|
Figure 9 Volume loss as function of sliding distance and applied load: (a) 5 N; (b) 10 N; (c) 15 N. |

|
Figure 10 Specific wear rate of PTFE composites as function of sliding distance (load 10 N). |

|
Figure 11 Variation in the friction coefficient according to sliding distance. |

|
Figure 12 SEM images of worn surfaces: (a) pure PTFE 250x; (b) pure PTFE 1000x; (c) carbon-filled PTFE 250x; (d) carbon-filled PTFE 1000x; (e) GF-filled PTFE 250x; (f) GF-filled PTFE 1000x. |

|
Figure 13 Tensile strength and elongation at break of pure PTFE and PTFE composites. |

|
Figure 14 Impact test results of pure PTFE and PTFE composites. |
In this paper, PTFE composites reinforced with carbon and GF were
fabricated and the effects of the filler materials on the mechanical and
tribological properties were investigated.
Tensile tests clearly demonstrated that the filler materials led to a
reduction of the PTFE tensile strength and elongation. The tensile strength
values of the pure and C/GF-filled PTFE were found as 28, 16.7 and
18.6 MPa, and values of elongation were obtained as 325, 80 and 250%,
respectively. Tensile tests clearly showed that the filler materials led to
reduction of the tensile strength of the PTFE. The Tg of pure
PTFE was 129.4 °C. The additives did not significantly affect the Tg,
which was found as 130.4 and 131.9 °C for GF- and C-filled PTFE,
respectively. The Izod impact test results showed that the filler materials
within the PTFE served to reduce the impact energy. Impact energy values of the
pure and the C-/GF-filled PTFE were obtained as 16.5, 8.5 and 13.5 kJ/m2,
respectively. In particular, the carbon filler reduced impact energy
significantly. The reinforcement materials also reduced the volume loss and
wear rate significantly. Therefore, C and GF fillers improved the wear
resistance of PTFE. However, no significant difference in effect was found
between the C and GF reinforcements, although the GF-filled PTFE provided a
lower friction coefficient.
- 1. Z. Wang, S. Wu, and J. Ni, Proc. Inst. Mech. Eng. Part J.-J. Eng., 232, 607 (2018).
-

- 2. Q. Zhao, Y. Liu, and C. Wang, Appl. Surf. Sci., 252, 1620 (2005).
-
- 3. R. Zhou, P. Yuan, Y. Wang, J. G. Hunsberger, A. Elkahloun, Y. Wei, P. D.-Williams, J. Du, G. Chen, and H. K. Manji, Neuropsychopharmacol, 34, 1395 (2009).
-
- 4. T. Hubáček, O. Lyutakov, V. Rybka, and V. Švorčík, J. Mater. Sci., 45, 279 (2010).
-
- 5. M. Fineschi, T. Gori, G. Sinicropi, and A. Bravi, Heart, 90, 490 (2004).
-
- 6. J. S. Choi, J. Y. Sohn, and J. Shin, Polym. Korea, 38, 457 (2014).
-
- 7. J. Y. Sohn, B. H. Park, J. M. Song, Y. M. Lee, and J. Shin, Polym. Korea, 37, 649 (2013).
-
- 8. N. Wang, H. Wang, J. Ren, G. Gao, S. Chen, and Y. Yang, J. Appl. Polym. Sci., 136, 47774 (2019).
-
- 9. L. J. van Rooyen, H. Bissett, M. C. Khoathane, and J. K. Kocsis, J. Appl. Polym. Sci., 133, 43369 (2016).
-
- 10. F. Li, K. A. Hu, J. L. Li, and B. Y. Zhao, Wear, 249, 877 (2001).
-
- 11. DuPont, Teflon® PFA Fluoropolymer Resin Properties Handbook, DuPont Fluoroproducts, Wilmington, 1998.
- 12. S. Kaner and T. Sekercioglu, Polym. Korea, 41, 827 (2017).
-
- 13. L. H. Lee, “Polymer Wear and Its Control”, in American Chemical Society, M. J. Comstock, Editor, Washington, Vol 287, p 27 (1985).
- 14. J. Khedkar, I. Negulescu, and E. I. Meletis, Wear, 252, 361 (2002).
-
- 15. K. Jotaki, M. Miyatake, T. Stolarski, S. Sasaki, and S. Yoshimoto, Tribol. Int., 113, 291 (2017).
-
- 16. F. Song, Q. Wang, and T. Wang, Tribol. Int., 104, 392 (2016).
-
- 17. W. G. Sawyer, K. D. Freudenberg, P. Bhimaraj, and L. S. Schadler, Wear, 254, 573 (2003).
-
- 18. M. Conte and A. Igartua, Wear, 296, 568 (2012).
-
- 19. J. Girard, N. Joset, A. Crochet, M. Tan, A. Holzheu, P. Brunetto, and K. Fromm, Polymer, 8, 208 (2016).
-
- 20. J. C. Seferis, Polym. Compos., 7, 158 (1986).
-
- 21. C. Liu, K. Chan, J. Shen, C. Liao, K. Yeung, and S. Tjong, Polymer, 8, 425 (2016).
-
- 22. F. Luo, B. Tang, Y. Yuan, Z. Fang, and S. Zhang, J. Alloy Compd., 769, 1034 (2018).
- 23. Y. Zhang, K. Kou, S. Zhang, and T. Ji, J. Polym. Res., 26, 214 (2019).
-
- 24. Y. Wang and Z. Yin, Ind. Lubr. Tribol., 71, 22 (2019).
-
- 25. S. Bhargava, M. E. Makowiec, and T. A. Blanchet, Wear, 444, 203163 (2020).
-
- 26. C. A. G. S. Valente, F. F. Boutin, L. P. C. Rocha, J. L. Vale, and C. H. Silva, Tribol. Trans., 63, 356 (2020).
-
- 27. F. L. Yin, H. Ji, and S. L. Nie, Proc. Inst. Mech. Eng. Part J.-J. Eng., 233, 1729 (2019).
- 28. R. Gheisari and A. A. Polycarpou, Wear, 436, 203044 (2019).
-
- 29. A. Charfi, S. Neili, M. Kharrat, and M. Dammak, J. Thermoplast. Compos. Mater., http://doi.org/10.1177/0892705719875203 (2019).
-
- 30. A. H. Wang, J. Xia, Z. X. Yang, and D. H. Xiong, Opt. Laser Technol., 116, 171 (2019).
- 31. M. Trabelsi, M. Kharrat, and M. Dammak, T. Indian I. Metals, 69, 1205 (2016).
-
- 32. E. Dhanumalayan and G. M. Joshi, Adv. Compos. Hybrid Mater., 1, 247 (2018).
- 33. D. M. Price and M. Jarratt, Thermochim. Acta, 392, 231 (2002).
-
- 34. D. Gong, Q. Xue, and H. Wang, Wear, 148, 161 (1991).
-
- 35. X. Teng, L. L. Wen, W. Tang, X. Zhao, and C. Chen, High Perform. Polym., 30, 752 (2018).
-
- 36. Y. Zhang, K. Kou, C. Pan, Z. Li, and T. Ji, J. Appl. Polym. Sci, 136, 48175 (2019).
-
- 37. F. Song, Q. Wang, and T. Wang, Tribol. Int., 104, 392 (2016).
-
- 38. R. Huang, S. Ma, M. Zhang, J. Yang, D. Wang, L. Zhang, and J. Xu, Materials, 12, 1082 (2019).
-
- 39. Z. Bi and D. W. Mueller, Friction, 7, 268 (2019).
-
- 40. I. Ovali, H. Karakoc, and H. Cinici, Manuf. Eng., 79, 19 (2016).
-
- 41. A. E. P. A. Baradeswaran and A. E. Perumal, Compos. Part B-Eng., 54, 146 (2013).
-
- 42. A. Abdollahi, A. Alizadeh, and H. R. Baharvandi, Mater. Design, 55, 471 (2014).
-
- 43. A. Yazdani and E. Salahinejad, Mater. Design, 32, 3137 (2011).
-
- 44. R. K. Goyal and M. Yadav, J. Appl. Polym. Sci., 127, 3186 (2013).
-
- 45. X. Hu, X. Yan, Y. Ma, and Y. Bai, Polym. Korea, 41, 68 (2017).
-
- 46. M. V. Chernets, S. V. Shilko, M. I. Pashechko, and M. Barshch, J. Frict. Wear, 39, 361 (2018).
-
- 47. R. Kaundal, A. Patnaik, and A. Satapathy, Proc. Inst. Mech. Eng. Part L.-J. Mat., 232, 893 (2018).
-
- 48. C. Liu, C. Long, L. Chen, J. Liu, T. Cao, and J. Zhang, Polym. Korea, 40, 836 (2016).
-
- 49. U. R. Hashim and A. Jumahat, Mater. Res. Express, 6, 025303 (2018).
-
- 50. R. A. Mohammed, Mater. Res. Express, 6, 125314 (2019).
-
- Polymer(Korea) 폴리머
- Frequency : Bimonthly(odd)
ISSN 0379-153X(Print)
ISSN 2234-8077(Online)
Abbr. Polym. Korea - 2023 Impact Factor : 0.4
- Indexed in SCIE
 This Article
-
2020; 44(4): 436-444
Published online Jul 25, 2020
- 10.7317/pk.2020.44.4.436
- Received on Jan 22, 2020
- Revised on Mar 26, 2020
- Accepted on Apr 30, 2020
Services
Shared
Correspondence to
- Yavuz Kaplan
-
Department of Mechanical and Manufacturing, Pamukkale University, 20020, Turkey
- E-mail: ykaplan@pau.edu.tr
- ORCID:
0000-0002-3144-9332
Hyecheon Building(Room 601), #354, Gangnam-Daero, Gangnam-Gu, Seoul 06242, Korea
TEL : 82-2-568-3860, 561-5203, 569-3860 FAX : 82-2553-6938 E-mail: polymer@polymer.or.kr