


- Cure Kinetics and Chemorheology of Silicone Rubber Modified Epoxy/Clay Nanocomposites
Sangmook Lee†

Division of Chemical Engineering, Dankook University, 126 Jukjeon-dong, Suji-gu, Gyeonggi-do 16890, Korea
- 실리콘 고무로 개질된 에폭시/클레이 나노콤포지트의 경화속도론 및 화학유변학
이상묵†
단국대학교 화학공학과
The curing behavior of
silicone rubber modified epoxy/clay nanocomposites was studied using a
differential scanning calorimeter (DSC) and an oscillatory rheometer. The
nanocomposites were prepared from the reaction of cycloaliphatic epoxy resins,
silicone rubber containing amine functional group, anhydride hardener and
nano-clay. As the clay content increased until 4 phr, the curing reaction rate
increased, the reaction heat decreased, and the gelation time decreased. The
isothermal cure results were well matched with the modified Kamal’s model.
Therefore, it is thought that the overall cure characteristics can be simulated
by applying a modified Kamal’s model
실리콘 고무로 개질된 에폭시/클레이 나노콤포지트의 경화 거동을 미분주사열량계(DSC)와 진동 레오미터를
이용하여 연구하였다. 지환형 에폭시 수지, 아민기를 포함하는
실리콘 고무, 무수 경화제, 나노클레이의 반응을 통해 나노콤포지트를
제조하였다. 클레이 함량이 4 phr로 증가함에 따라 경화
속도는 증가하였고 반응열은 감소하였으며 젤화 시간은 감소하였다. 등온경화 실험의 결과는 개선된 Kamal 모델에 잘 부합하였다. 이에 개선된 Kamal 모델을 적용하여 본 시스템의 전체적인 경화특성을 모사할 수 있으리라 사료된다
The curing behavior of the silicone rubber-modified epoxy/clay nanocomposites was illustrated together with the experimental values and the calculated results. The experimental data were well matched with their calculations using the modified Kamal equation.
Keywords: silicone rubber, cycloaliphatic epoxy, cure kinetics, chemorheology, nano-clay
The present research was supported by the research fund of Dankook
University in 2019 (No: R201900746). Special thanks are due to Dr. Young Gi
Hong for his help with the experiments.
Epoxy resin has excellent mechanical, chemical, and electrical
properties, and is a great general-purpose material widely used as electrical
and electronic materials and aerospace composite materials. Due to its brittle
properties, however, many studies have been carried out to improve it.1-4
As part of such efforts, additions of various rubbers to it or its reactions
with high
molecules of silicone or urethane were attempted.5-7 In particular,
there has been a lot of research recently on the copolymerization of siloxane and
epoxy.8-10 However, the copolymerization of siloxane is complex in
the reaction process and requires very demanding management, such as a number
of processes, for immediate application and utilization in the field.
The properties of epoxy resin are predetermined by the chemical structure
of resin and hardener before curing as well as the network structure after
curing. Therefore, the type and structure of the segments that make up the
molecular chain, and the cure conditions during processing have a significant
influence on the network structure. In order to optimize the physical
characteristics of the final product by controlling the reaction in the
commercial process, the curing rate and reaction activation energy at different
temperatures should be known. Thus, the study of curing kinetics is essential
to investigate the relationship between the structure and properties of epoxy
resin. The reaction kinetics studies have been mainly reported using
spectroscopic instruments such as FTIR, NMR, and Raman11-13 and the
thermal decomposition reaction kinetics has been studied using TGA.14-16
DSC has been also widely used to study the exothermic curing reaction of
thermosetting resin.17-19
In this study, the modified epoxy resin with flexible siloxane segment
was manufactured by reacting the cycloaliphatic epoxy resin with the commercial
liquid silicone resin containing amine functional groups. Then, anhydride
hardener, imidazole catalyst, and nano-clays were added to it and its curing
behavior was investigated using DSC and oscillatory rheometer. In the future,
the thermal and mechanical properties and morphology of the cured samples will
also be studied.
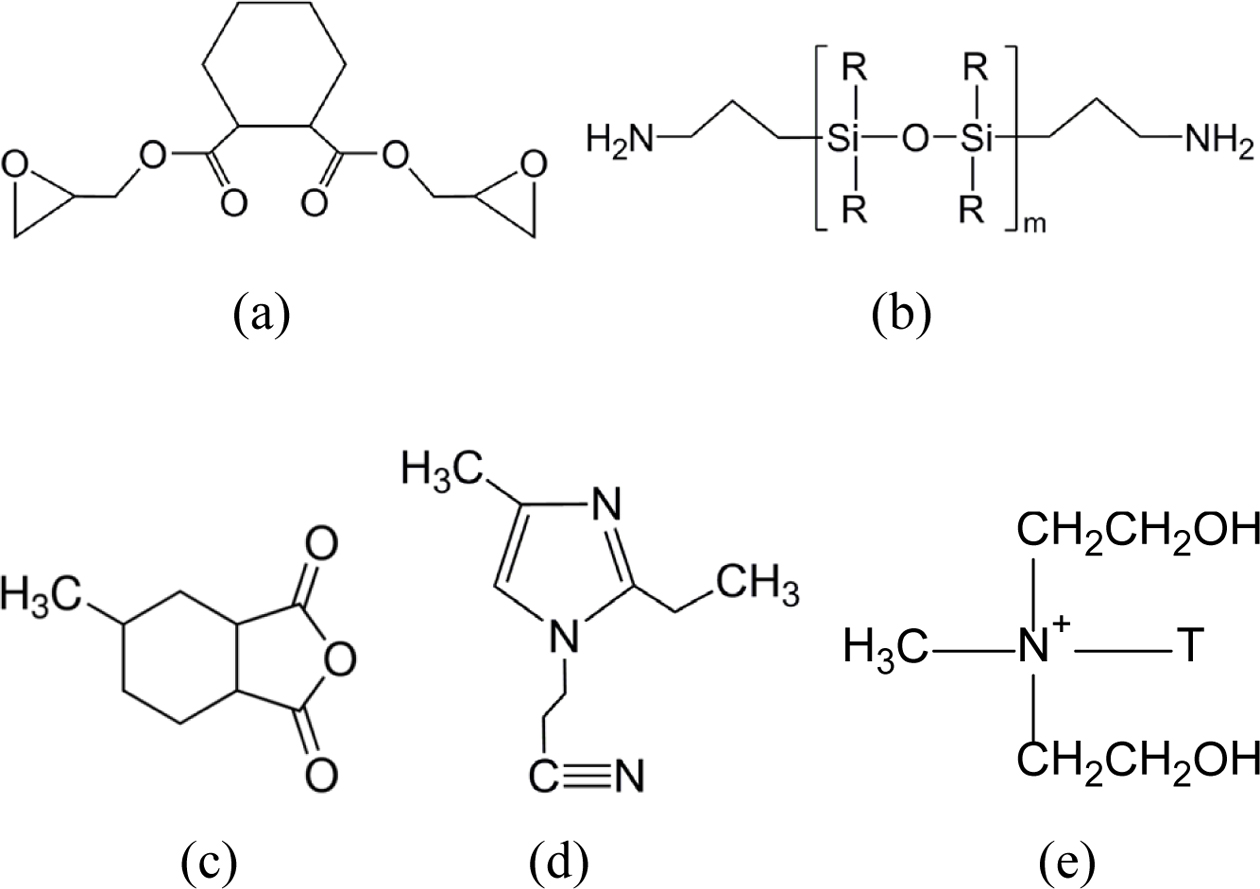
Materials. The epoxy resin used in this
study was cycloaliphatic type ES602 of Hajin Chemtec Co. with epoxy equivalence
of 164~177 g. The liquid silicone resin was DC3055 of Dow Corning with
amine equivalence of 250~270 g. The HJ5500 (methyl hexahydrophthalic
anhydride) of Hajin Chemtec Co. with equivalence of 166 g was used as a curing agent.
1-cyanoethylene-2-ethyl-4-methyl imidole (2E4MZ-CN) of Shikoku Kasei, Japan was
used as an accelerator. Nano-clay was Cloisite 30B (Southern Clay, USA). All
materials in this study were used without further purification and the chemical
structures are shown in Figure 1.
Nanocomposite
Preparation. Silicone resin and epoxy resin were preheated at 50 oC
and mixed at 500 rpm for 10 min. Nano-clay, anhydride hardener, and accelerator were
added to it and mixed for another 5 min, followed by an ultrasonic
treatment using the ultrasonic horn (1500 W, 20 kHz) for 20 min. The
bubbles in the mixture were removed in a vacuum oven for 15 min. The
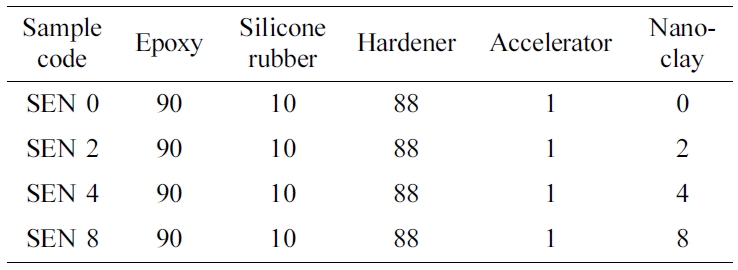
mixing ratio of silicone rubber modified epoxy nanocomposite (hereinafter
referred to as SEN) in this study is as shown in Table 1. These prepared
mixtures were cured according to the heat applied to the differential scanning
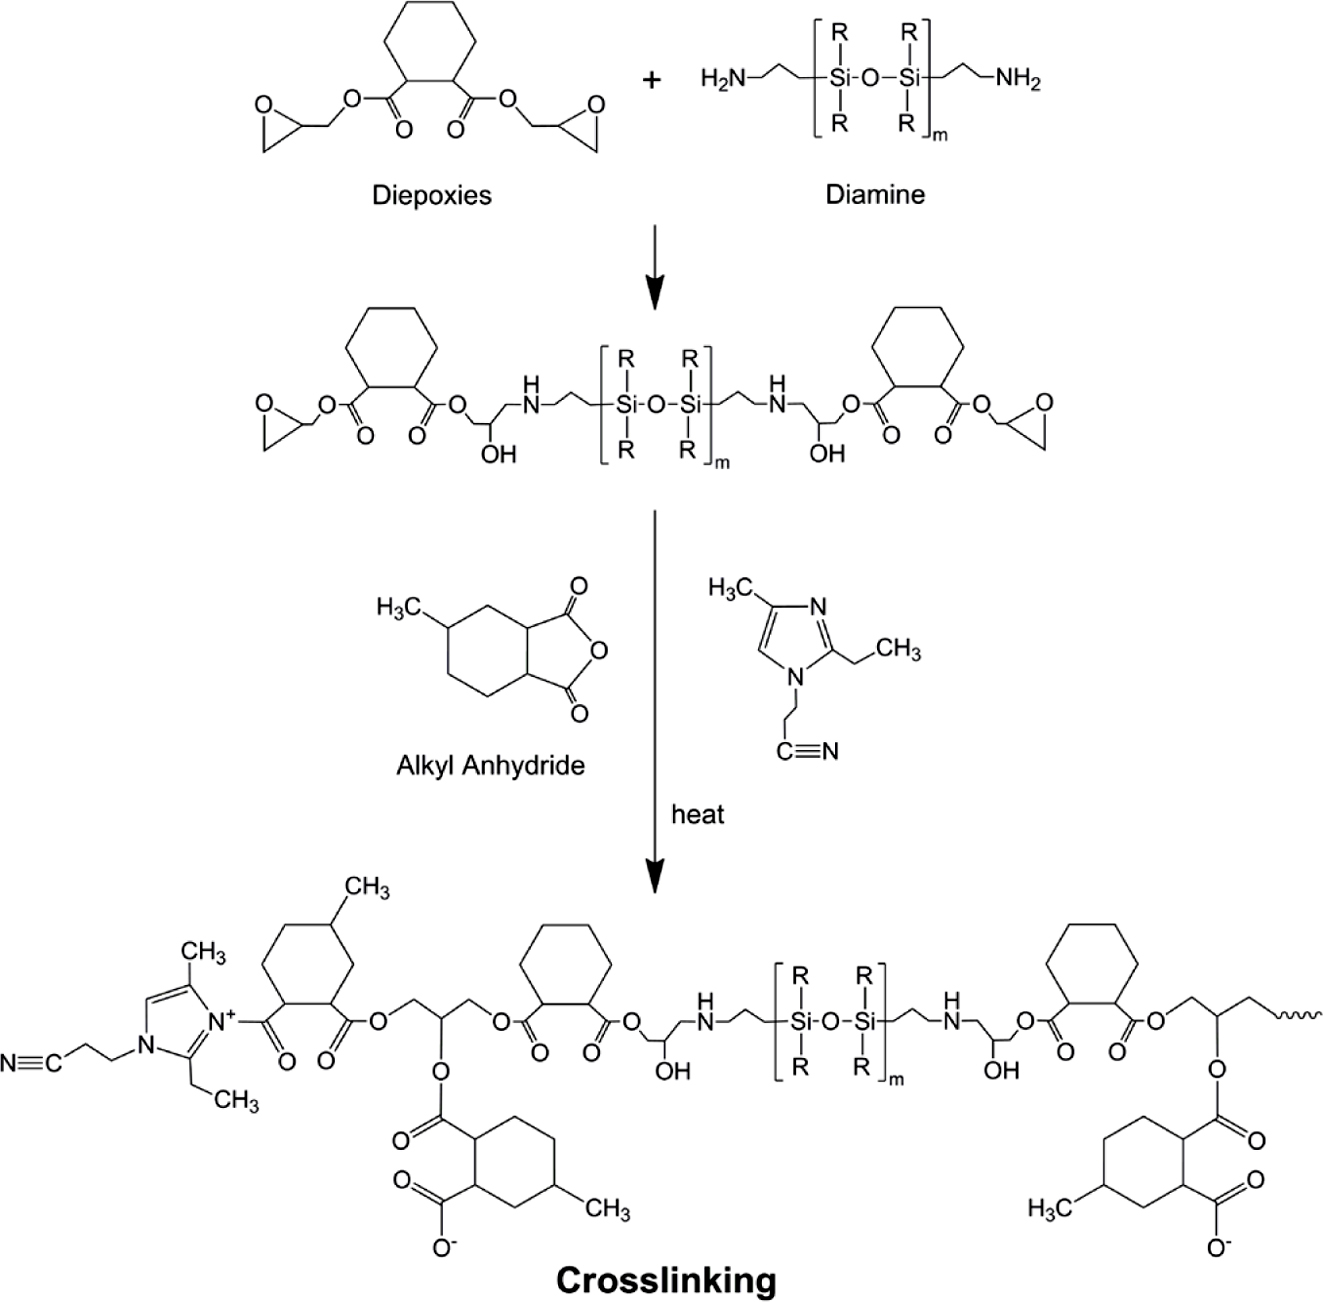
calorimeter (DSC) and the rheometer measurement. The curing reaction process of
above silicone rubber-mixed epoxy resin and anhydride hardener is illustrated
in Figure 2.
Instruments. The differential scanning
calorimeter (DSC, DSC2910, TA Instrument) was used to measure the thermal
behavior by the curing reaction. The prepared uncured specimen was contained
about 10±3 mg in a hermetic pan and was
dynamically scanned under nitrogen
at a rate of 5, 10, 15, 20 oC/min. The isothermal heat curves
were also obtained by curing them at 120, 130, 140, 150, and 160 oC.
The rheological measurements were conducted using a stress-controlled
rotational rheometer (Physica MCR500, Anton Parr), to examine the viscoelastic
properties in terms of the h*, G', and G".
A 25 mm diameter parallel plate was mounted with a gap size of 1 mm. For
all specimens, the frequency was 10 rad/s and the temperatures were at 80, 90,
100, and 120 oC.
|
Figure 1 Chemical structures of the materials used in this study: (a) epoxy (ES602); (b) silicone rubber (DC3055); (c) hardener (HJ5500); (d) accelerator (2E4MZ-CN); (e) nano-silicate (cloisite 30B). |
|
Figure 2 Reaction scheme of silicone rubber modified epoxy with anhydride. |
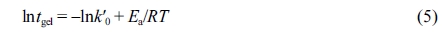
Dynamic
Curing Kinetics. Figure 3 is the result of thermal analysis of SENs when
changing clay content while keeping DSC at a constant heating rate of 15 oC/min.
All samples started to release heat at about 75 oC, showed peak
near 160 to 170 oC, and stopped heat near 200 to 250 oC.
As the clay content increased, the heat peak moved toward
lower temperatures and the peak
height decreased. This is due to the acceleration effect of the reaction of
ammonium and hydroxyl groups on the surface of the clay, resulting in faster
reaction as the clay content increased.20,21 In addition, at high
temperatures, organic ions in the nanocomposite promote homopolymerization21
and reduce reaction heat due to reduced crosslinking density.22
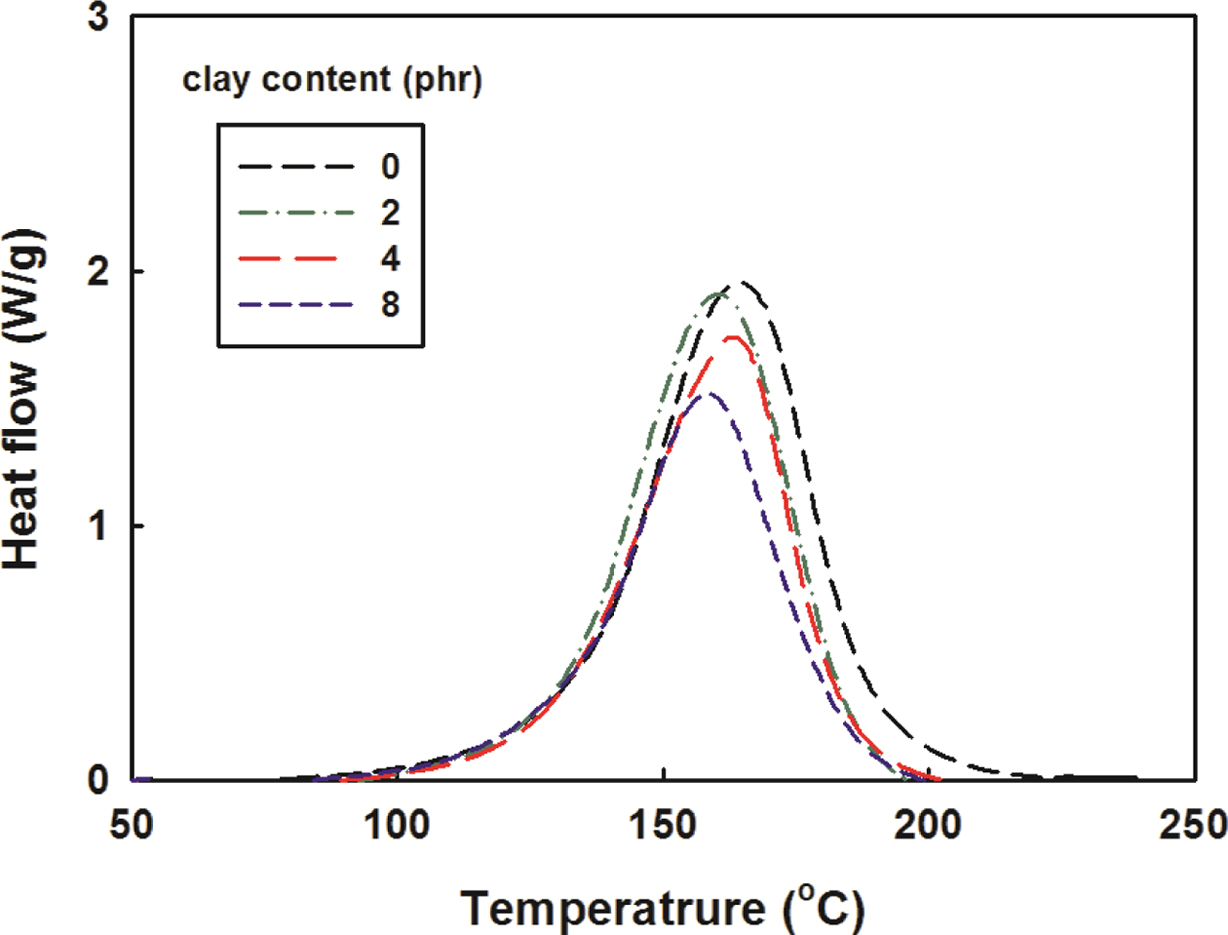
To calculate reaction activation energy from the dynamic DSC data of the
SENs, the following expressions were derived by Kissinger.23
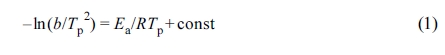
where b is the heating rate (oC/min), Tp
is the peak temperature (K) on the DSC curve, and R is the gas constant.
This equation was derived under the assumption that the degree of cure at the peak temperature, ap, is constant regardless of the heating rate, and
has been applied to several types of thermosetting resins.24,25
Figure 4 is a Kissinger plot that illustrated ln(b/Tp2)
as a function of 1000/Tp to apply the DSC results with
different scanning temperatures to eq. (2). Although there were some errors,
the results were generally close to straight lines.
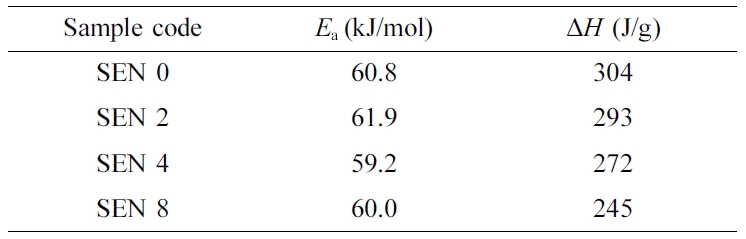
The amount of heat integrated on the peak and the reaction activation
energy obtained from the slope of the trend line were summarized in Table 2.
The amount of heat decreased as the clay content increased, while the reaction
activation energy was almost the same. It is therefore thought that changes in
the content of the clay have little effect on the activation energy.
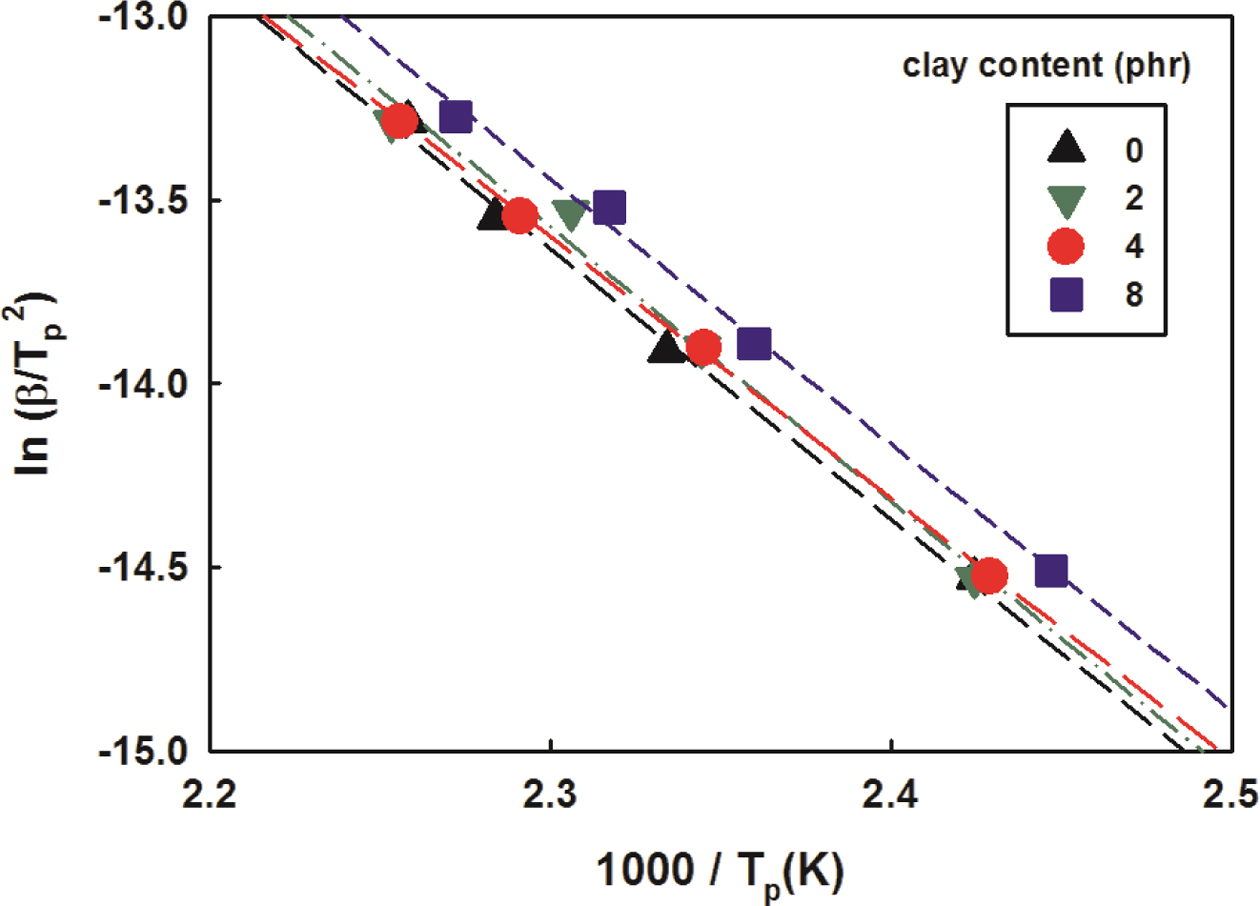
Degree of cure was obtained by dividing the running integral value of the
heat release rate by the total reaction heat, and the results are illustrated
in Figure 5. As the
temperature increased the degree of cure gradually increased in the
initial cure stage and then sharply increased to approach 1 at the end. When
the clay was added, this phenomenon began at much lower temperatures and the
difference according to clay content was not significant.
This temperature shift is attributed to the heat transfer effect due to
the addition of clay with high thermal conductivity. When a sample is exposed
to heat, the temperature of the entire sample does not reach the set temperature.
The more samples you have, the more time it takes for heat to penetrate.
Furthermore, polymeric materials take longer due to their low thermal
conductivity. However, when a material with a high thermal conductivity is
mixed, heat is quickly penetrated and the reaction starts faster.
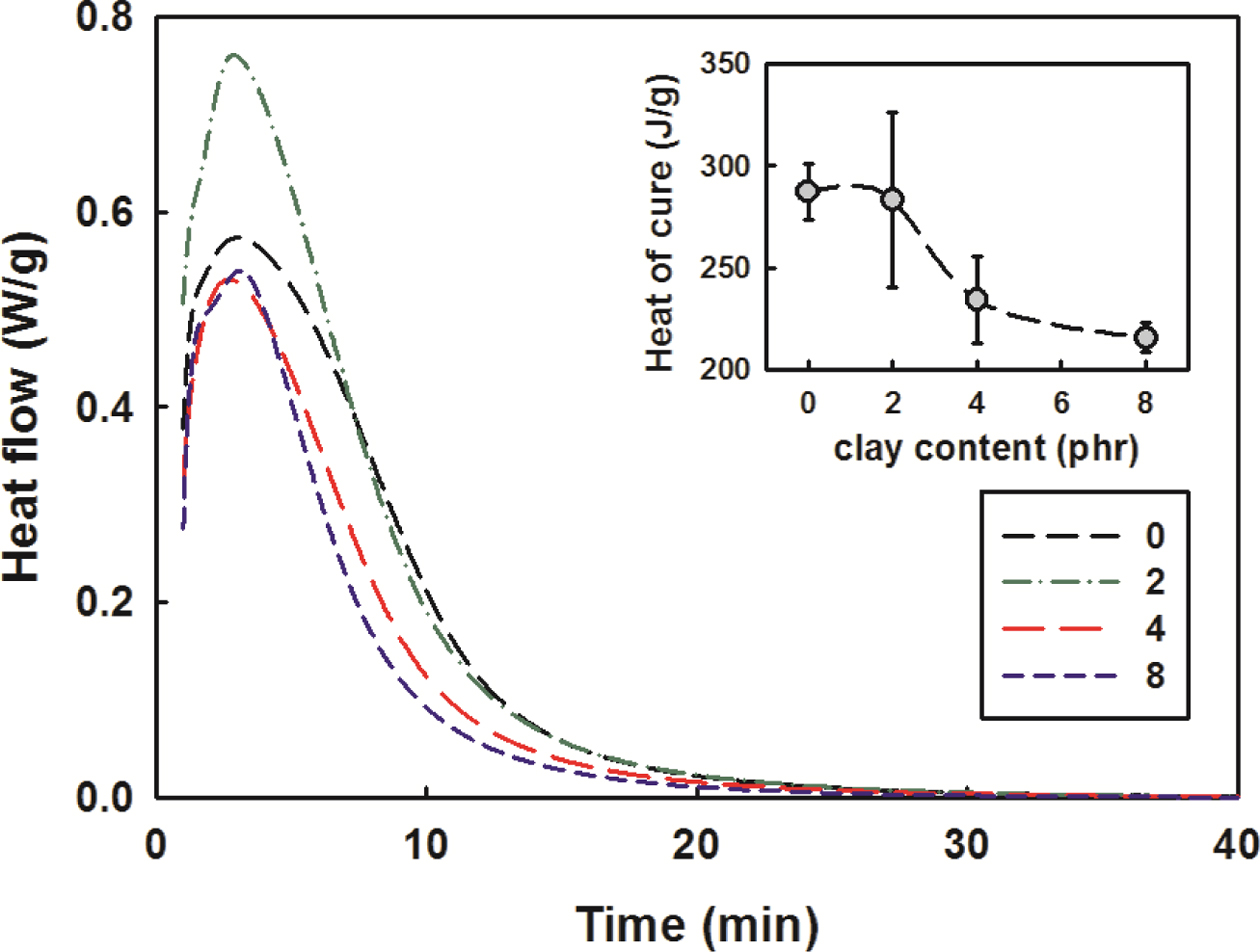
Isothermal
Curing Kinetics. In Figure 6, the DSC thermogram of SEN was illustrated
when the clay content was changed while the set temperature of DSC was kept
constant at 130 oC. In the initial few minutes the heat flow
curves show no tendency, because no matter how much well DSC works, when the
cell lid is opened to place the SEN sample in DSC, the isothermal condition is
destroyed and it takes time to reach the thermal equilibrium again. Thus, the
records in the initial few minutes may appear to be somewhat smaller than the
actual heat.
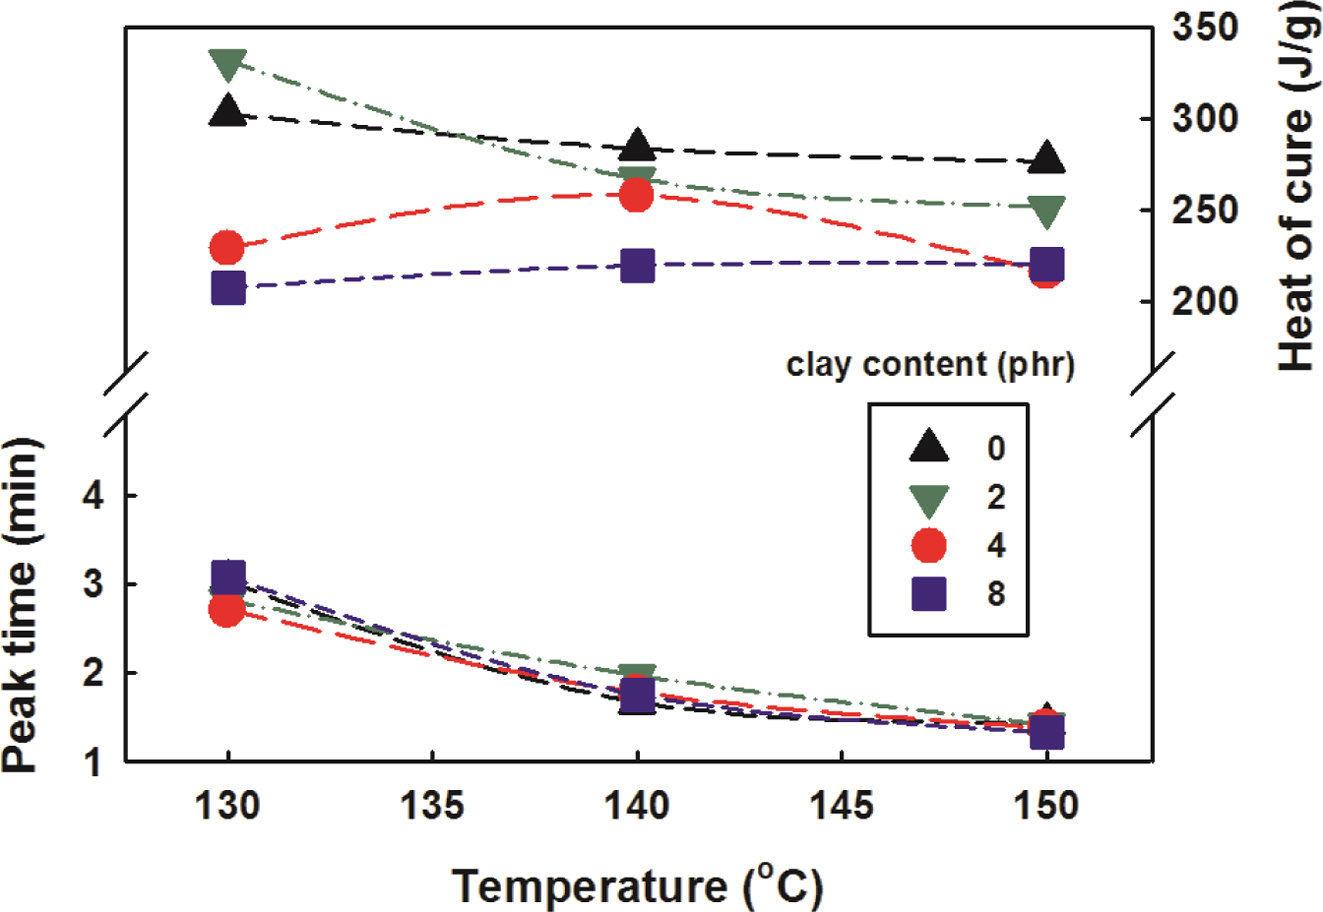
Figure 7 shows the peak time and heat of cure as a function of
temperature and clay content. As the temperature increased, the peak time
progressed faster and the heat of cure decreased slowly as a whole. It was
similar to the dynamic cure reaction analysis. The small picture in Figure 6
shows the changes in heat of cure in more detail as the clay content increased.
As the clay content increased, the heat generation decreased dramatically at
over 2 phr of clay content, but there was no significant change at over 4 phr
of clay content.
The Kamal equation is a phenomenological model that considers the curing
reaction of epoxy resin to be an autocatalytic reaction when cured at
isothermal.26
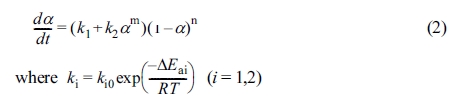
where k1 and k2 are the reaction rate
constants for non-autocatalytic and autocatalytic reaction, respectively. m
and n are the catalytic constants, k10 and k20
are the pre-exponential factors, and Ea1 and Ea2
are the activation energies.
The curing behavior of the epoxy begins initially with
activation-controlled reaction, but as the reaction progresses gradually, the
mechanism switches to diffusion-controlled. To express this, the modified
Kamal’s model corrected by introducing the diffusion factor, f (a), is shown in eq. (3).26-30
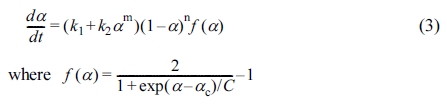
where ac is the maximum
degree of cure for a given cure temperature and C is the diffusion
parameter.
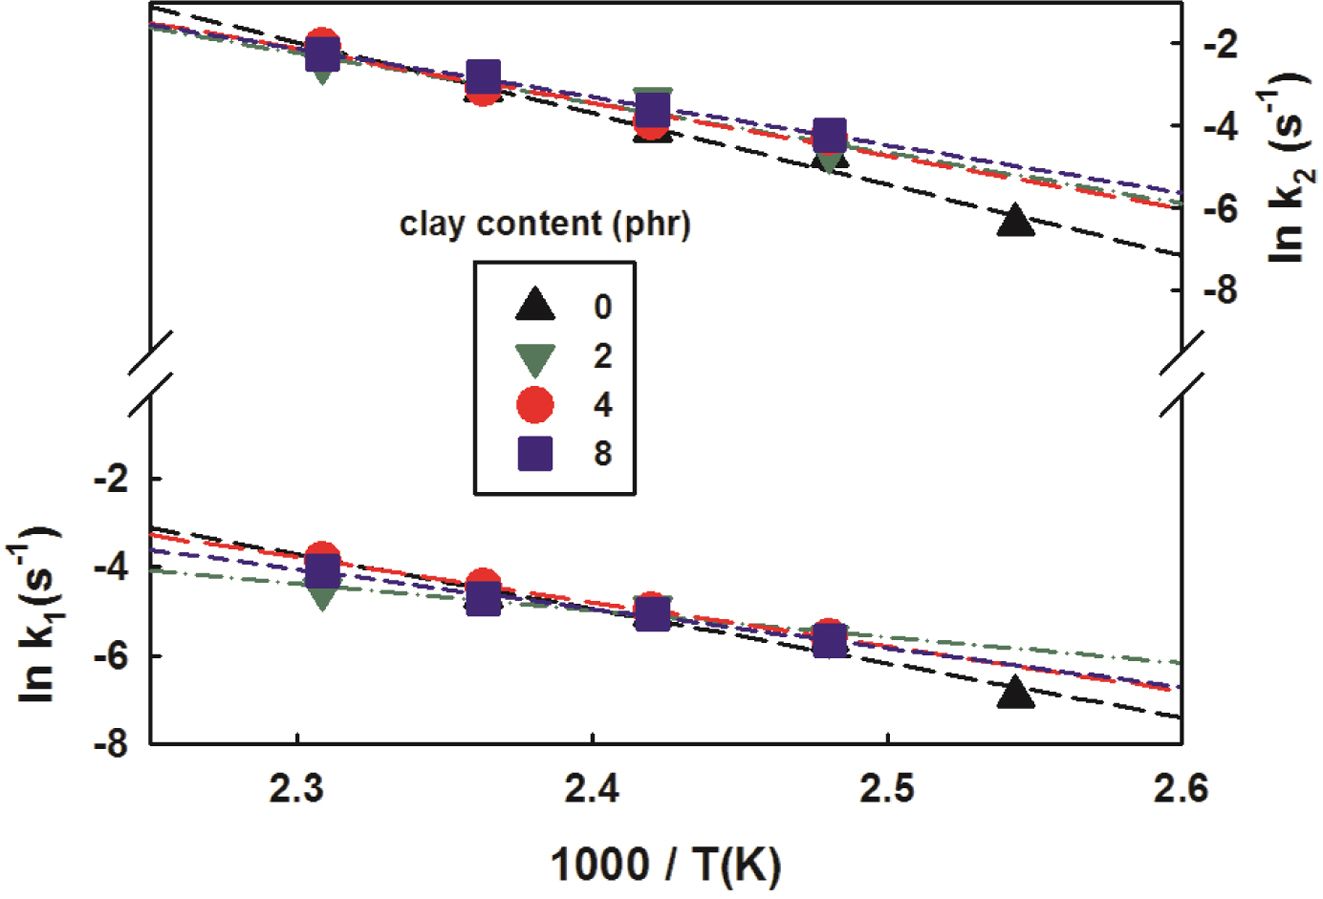
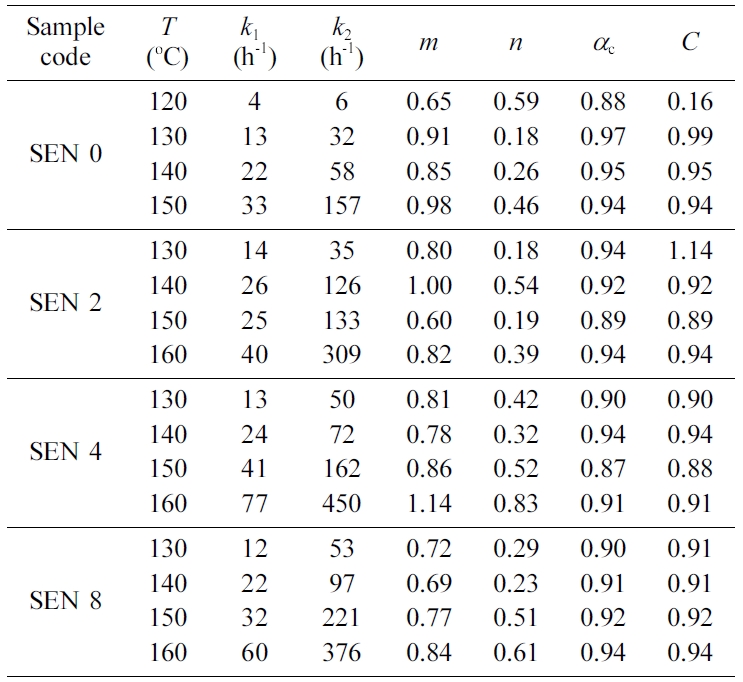
The values of kinetic variables for the modified Kamal’s model were
obtained using a multivariable regression method and are listed in Table 3. The
higher the temperature, the higher the reaction rate constant k1
and k2 were, the more pronounced the k2
was. On the other hand, the clay content had little effect on the reaction rate
constants. The values of m and n were not constant and had
large deviations regardless of the
clay content. ac showed a value
between 0.87 and 0.97 without a constant tendency. The values of diffusion
parameter C were also almost the same regardless of the clay content.
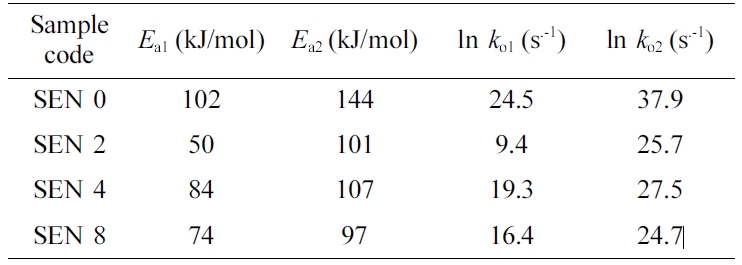
In order to obtain the reaction activation energies and pre-exponential
factors, the natural logarithm to the rate constants was taken and their values
were plotted against the reciprocal of the temperature, resulting in near
straight lines as shown in Figure 8. The reaction activation energies and
pre-exponential factors were obtained from the slopes and the intercepts of the
straight lines respectively and are summarized in Table 4. As the clay content
increased, it was seen that the values of reaction activation energies and pre-exponential
factors decreased overall.
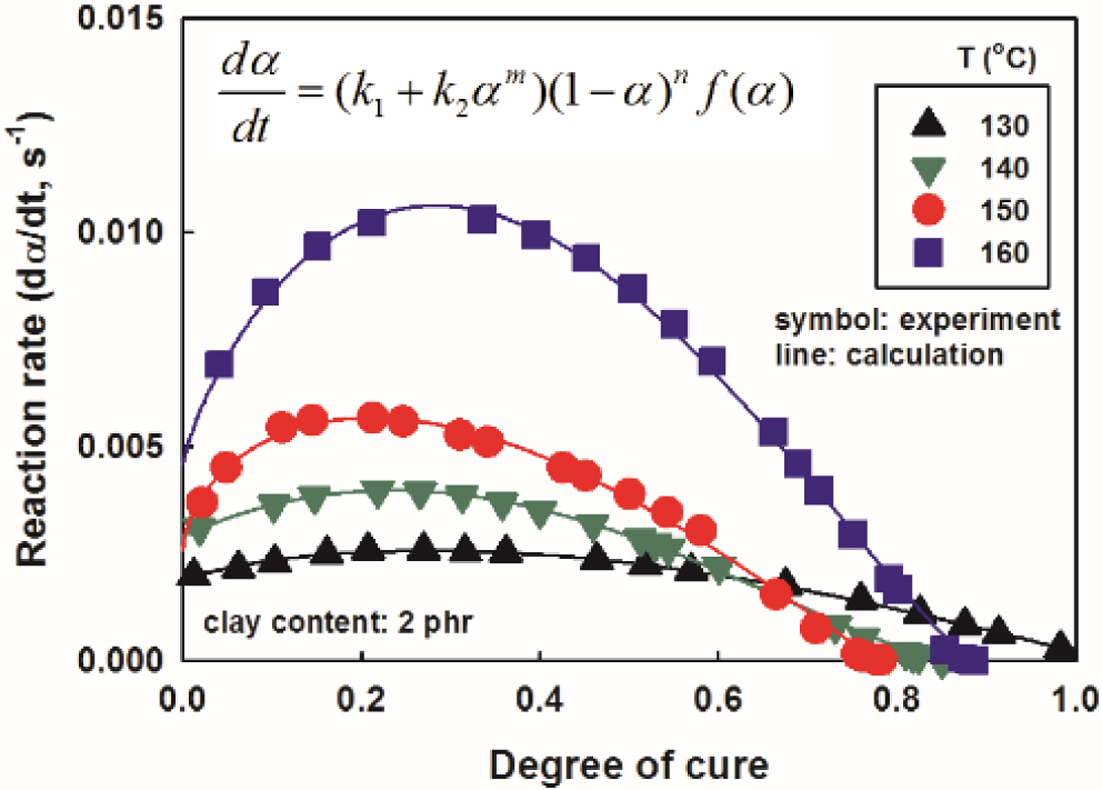
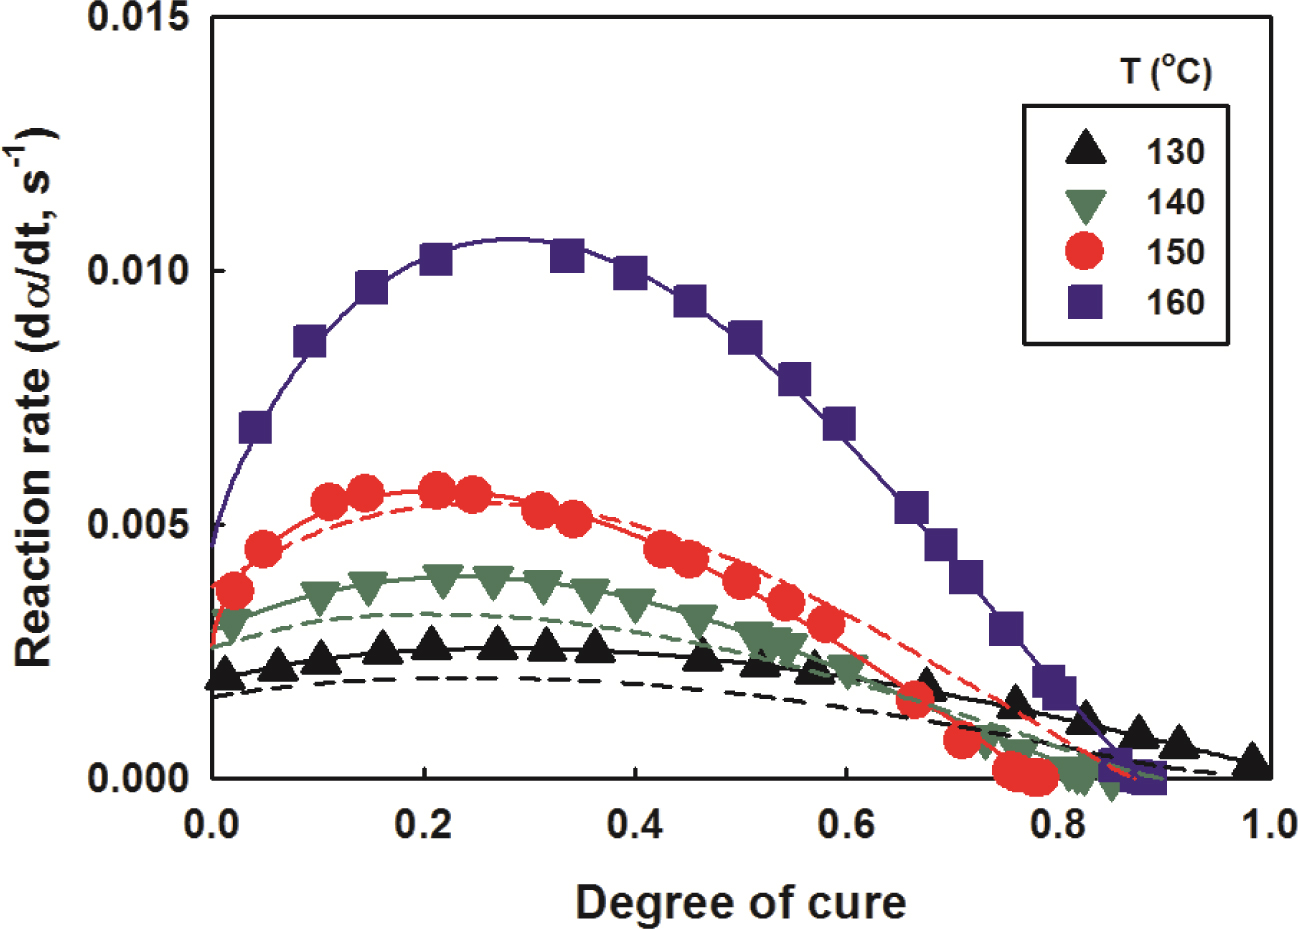
The reaction activation energies and pre-exponential factors of the cure
kinetic equation obtained from the above could be applied to the modified Kamal
model to calculate the cure rate. The rate of cure vs. degree of cure of
the nanocomposites with a clay content of 2 phr was illustrated in Figure 9,
together with the experimental values. As the degree of cure increased, the
rate of cure increased, showed the maximum value at around degree of cure 0.3
and decreased again. The higher the cure temperature, the more significantly
the rate of cure increased. The results for other contents were omitted due to
similar trends, with only
differences in reaction rate values. It was thought that these measured
values of the curing rate would be somewhat lower than the actual values. It is
because the heat released and spread throughout the sample was recorded by DSC
before equilibrium was reached.31,32 The experimental data of the
curing rate were well matched with their calculations using the modified Kamal
equation. Therefore, it is believed that the modified Kamal model well
represents the cure process in this study.
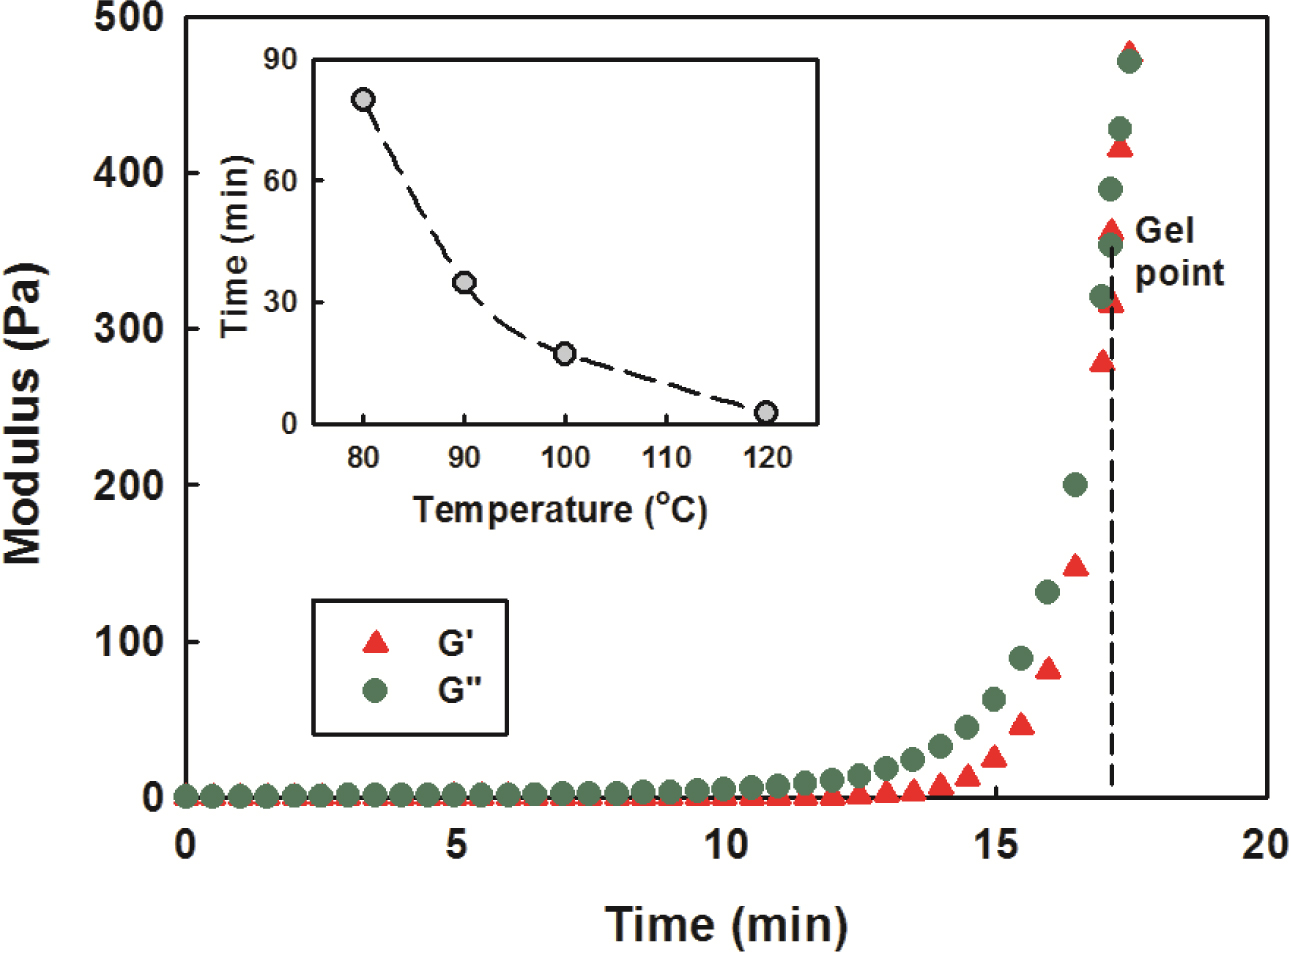
Chemorheology. The rheological properties of
the nanocomposites were investigated at different temperatures. The changes in
the storage modules G' and the loss modulus G" during the
curing were measured. As shown in Figure 10, the G' and G"
showed a gradual increase over time, then a sharp increase in a particular time
zone. This is due to that the molecular mobility decreases gradually as the
curing progresses and decreases rapidly as crosslinking between molecules
begins. This trend was noticeable when the temperature was higher, and the time
when the G' and G" began to increase rapidly was also
shortened, which is thought to be due to the fast reaction at higher
temperatures.
As the curing progresses, it is necessary to define the first time a
high-molecular weight polymers appears, called the gel point. It is very
important to know the gel time of the material that crosslinks in the actual
process because it is almost impossible to process after the gelation time due
to the very high viscosity. In general, the gel time is defined as the time to
reach the inflection point of the change in viscosity or the intersection of
the storage modulus G' and the loss modulus G", i.e. tan δ = 1.33
It also means the transition from a viscous fluid to a viscous solid due to
sufficient entanglement in the polymer chain, and the case of the nanocomposite
with a clay content of 2 phr at 100 oC is shown in Figure 10.
The small picture shows a change in
gel time as a function of temperature, which resulted in a decrease
according to Arrhenius formula as the temperature increased. The time of
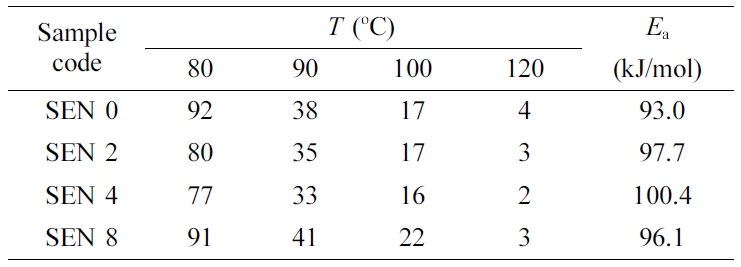
gelation according to clay content and temperature was given in Table 5. It
could be seen that the gel time decreased as the cure temperature increased at
each content. On the other hand, the gel time decreased as the clay content
increased, but increased again when the clay content was 8 phr. It is thought
to be due to the catalytic effect of clay as explained in Figure 3 and the role
of clay as a heat sinker. In other word, the catalytic effect was dominant in
low clay content, but in high clay content, the heat loss was greater,
resulting in longer gelation time.
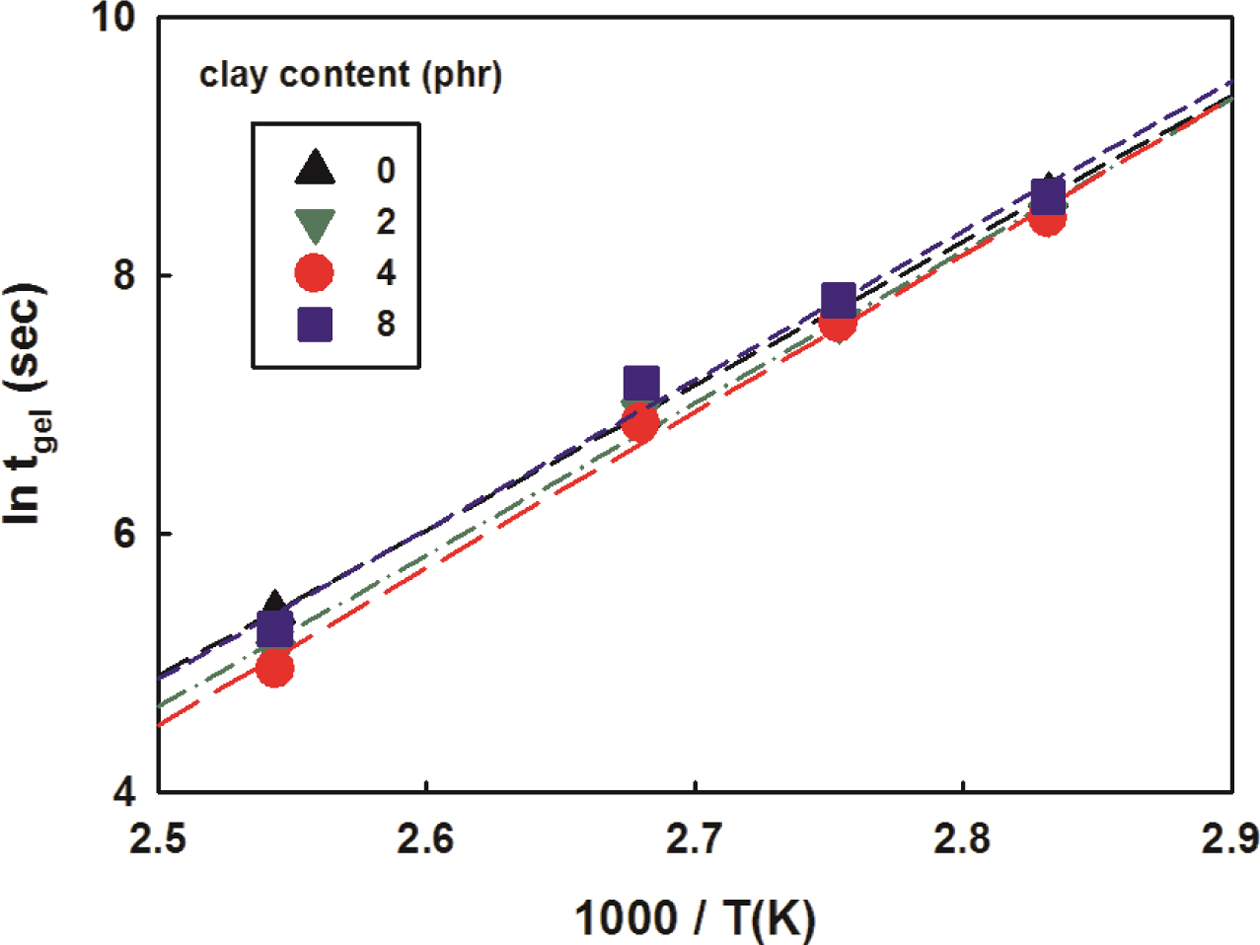
The relationship between gelation time and temperature can be expressed
in the form of Arrhenius Law.34
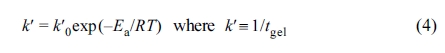
where k' is the rate constant obtained using gelation time, k'0
is the pre-exponential factor, Ea is the activation energy,
and R is the gas constant. The natural logarithm on both sides of the
eq. (4) is as follows.
Therefore, the change in the gel time based on the intersections of
modulus under isothermal conditions was illustrated as a function of the
reciprocal of the temperature in Figure 11. As the clay content increased, the
intercept of plot decreased, which means shorter gelation time. The activation
energies obtained from the slopes were added to Table 5. An increase in
activation energy could be seen as clay content increased. The activation
energy values obtained here showed some deviation from those obtained using
Kissinger equation in the dynamic curing study. This is thought to be due to
the amount of samples and the heating mode used in the cure kinetics experiment
being different from those used in the chemorheology experiment, resulting in a
different heat transfer effect. The amount of samples used in the dynamic cure
kinetics is several mg, whereas that in the chemorheology is several g.
Therefore, the difference of time lag is inevitable to reach the set
temperature. There are also different heating mechanism and temperature
sensing mechanism between the two methods.
|
Figure 3 DSC curves of the nanocomposites at different clay contents at a heating rate of 15 oC/min. |
|
Figure 4 ln(b/Tp 2) vs 1000/Tp of the nanocomposites at different clay contents. |
|
Figure 5 The degree of cure of the nanocompoistes at a heating rate of 15 oC/min with varying clay content. |
|
Figure 6 Isothermal DSC curves of the nanocomposites at 130 oC with varying clay content. |
|
Figure 7 Isothermal peak time and heat of cure vs temperature of the nanocomposites at different clay contents. |
|
Figure 8 Arrhenius plot for the rate constant of the nanocomposites at different clay contents. |
|
Figure 9 Rate of cure vs degree of cure of the nanocomposites (clay 2 phr): experimental results (symbol); modified Kamal’s model (line). Dashed lines are the simulated results at clay 0 phr. |
|
Figure 10 G' and G" vs time of the nanocomposites (clay 2 phr) isothermally cured at 100 oC. |
|
Figure 11 ln tgel vs 1000/T of the nanocomposites at different clay contents. |
|
Table 4 Reaction Activation Energy and Pre-exponential Factor of the Nanocomposites at Different Clay Contents |
|
Table 5 Gel Time (min) and Activation Energy of the Nanocomposites at Different Clay Contents |
The curing reaction was made by adding anhydride hardener, nano-clay, and
accelerator to the cycloaliphatic epoxy resin modified with the liquid silicon
rubber. Using DSC dynamic analysis, the reactivity of the mixture was
investigated. As the clay content increased, the curing rate increased, the
reaction heat decreased, and the activation energy changed little. Similar
results were found in DSC isothermal analysis and the experimental values of
isothermal curing reactions were well matched with the calculation of modified
Kamal’s model. Reactivity was also tested under constant shear rate in a
rheometer and the gelation time was shortened as the clay content increased.
Therefore, by adding a small amount of nano-clay to the cycloaliphatic epoxy
resin modified with silicone rubber, it is believed that the outdoor purpose
epoxy nanocomposites with enhanced processibility as well as good flexibility
and weather resistance can be obtained.
- 1. R. Bagheri, B. T. Marouf, and R. A. Pearson, Polym. Rev., 49, 201 (2009).
-

- 2. L.-X. Gong, L. Zhao, L.-C. Tang, H.-Y. Liu, and Y.-W. Mai, Compos. Sci. Technol., 121, 104 (2015).
-
- 3. H. Zhou and S. Xu, Mater. Lett., 121, 238 (2014).
-
- 4. S. A. Xu, G. T. Wang, and Y. W. Mai, J. Mater. Sci., 48, 3546 (2013).
-
- 5. S. K. Rath, J. G. Chavan, S. Sasane, Jagannath, M. Patri, A. B. Samui, and B. C. Chakraborty, Appl. Surf. Sci., 256, 2440 (2010).
-
- 6. A. A. Prabu and M. Alagar, Prog. Org. Coat., 49, 236 (2004).
-
- 7. T. H. Hsieh, A. J. Kinloch, K. Masania, J. S. Lee, A. C. Taylor, and S. Sprenger, J. Mater. Sci., 45, 1193 (2010).
-
- 8. J. J. Chrusciel and E. Lesniak, Prog. Polym. Sci., 41, 67 (2015).
-
- 9. R. Li, H. Zhang, C. Zhou, B. Zhang, Y. Chen, H. Zou, and M. Liang, Appl. Polym. Sci., 134, 45272 (2017).
-
- 10. B. Li, C. He, W. Lu, J. Wang, Y. Zeng, and B. Gao, Prog. Org. Coat., 126, 178 (2019).
-
- 11. Z. Niu, G. Liu, H. Yin, C. Zhou, D. Wu, B. Yousaf, and C. Wang, Energ. Convers. Manage., 124, 180 (2016).
-
- 12. G. Zheng, L. Polavarapu, L. M. Liz-Marzan, I. Pastoriza-Santos, and J. Perez-Juste, Chem. Comm., 51, 4572 (2015).
-
- 13. M. Cha, K. Shin, H. Lee, I. L. Moudrakovski, J. A. Ripmeester, and Y. Seo, Environ. Sci. Tehnol., 49, 1964 (2015).
-
- 14. Q.-V. Bach and W.-H. Chen, Bioresource Technol., 246, 88 (2017).
-
- 15. K. Azizi, M. K. Moraveji, and H. A. Najafabadi, Bioresource Technol., 243, 481 (2017).
-
- 16. Y. Lin, Y. Liao, Z. Yu, S. Fang, Y. Lin, Y. Fan, X. Peng, and X. Ma, Energ. Convers. Manage., 118, 345 (2016).
-
- 17. J. Hu, J. Shan, J. Zhao, and Z. Tong, Thermochim. Acta, 632, 56 (2016).
-
- 18. J. Xu, Y. Jiang, T. Zhang, Y. Dai, D. Yang, F. Qiu, Z. Yu, and P. Yang, Prog. Org. Coat., 122, 10 (2018).
-
- 19. J. D. Thanki and P. H. Parsania, J. Therm. Anal. Calorim., 130, 2145 (2017).
-
- 20. J. Park and S. C. Jana, Polymer, 45, 7673 (2004).
-
- 21. S. K. Sahoo, S. Mohanty, and S. K. Nayak, Prog. Org. Coat., 88, 263 (2015).
-
- 22. P. I. Xidas and K. S. Triantafyllidis, Eur. Polym. J., 46, 404 (2010).
-
- 23. H. E. Kissinger, Anal. Chem., 29, 1702 (1957).
-
- 24. X. Sheng, M. Akinc, and M. R. Kessler, J. Therm. Anal. Calorim., 93, 77 (2008).
-
- 25. G. Gheno, R. Ganzerla, M. Bortoluzzi, and R. Paganica, Prog. Org. Coat., 78, 239 (2015).
-
- 26. M. R. Kamal and M. E. Ryan, Polym. Eng. Sci., 20, 859 (1980).
-
- 27. N. Rabearison, Ch. Jochum, and J. C. Grandidier, J. Mater. Sci., 46, 787 (2011).
-
- 28. F. X. Perrin, T. M. H. Nguyen, and J. L. Vernet, Eur. Polym. J., 43, 5107 (2007).
-
- 29. C. D. Han and K. W. Lem, Polym. Eng. Sci., 24, 473 (1984).
-
- 30. K. C. Cole, J. J. Hechler, and D. Noel, Macromolecules, 24, 3098 (1991).
-
- 31. S. Montserrat, G. Andreu, P. Cortes, Y. Calventus, P. Colomer, J. M. Hutchinson, and J. Malek, J. Appl. Polym. Sci., 61, 1663 (1996).
-
- 32. R. A. Fava, Polymer, 9, 137 (1968).
-
- 33. Cure behavior by dynamic mechanical analysis ASTM D4473.
- 34. H. Teil, S. A. Page, V. Michaud, and J.-A. E. Manson, J. Appl. Polym. Sci., 93, 1774 (2004).
-
- Polymer(Korea) 폴리머
- Frequency : Bimonthly(odd)
ISSN 0379-153X(Print)
ISSN 2234-8077(Online)
Abbr. Polym. Korea - 2023 Impact Factor : 0.4
- Indexed in SCIE
 This Article
-
2020; 44(2): 163-169
Published online Mar 25, 2020
- 10.7317/pk.2020.44.2.163
- Received on Oct 28, 2019
- Revised on Dec 7, 2019
- Accepted on Dec 23, 2019
Services
- Full Text PDF
- Abstract
- ToC
- Acknowledgements
Introduction
Experimental
Results and Discussion
Conclusions
- References
Shared
Correspondence to
- Sangmook Lee
-
Division of Chemical Engineering, Dankook University, 126 Jukjeon-dong, Suji-gu, Gyeonggi-do 16890, Korea
- E-mail: s_mlee@naver.com
- ORCID:
0000-0001-8965-3590
Hyecheon Building(Room 601), #354, Gangnam-Daero, Gangnam-Gu, Seoul 06242, Korea
TEL : 82-2-568-3860, 561-5203, 569-3860 FAX : 82-2553-6938 E-mail: polymer@polymer.or.kr