- Evaluation of Non-isothermal Melt Crystallization Kinetics of thePoly(lactic acid)/Graphene Composites under Variant Cooling Circumstances via Solidification Analysis Approach
Bin Yang†
 , Peng Zhang, Shu-Chun Zhao, Ru Xia, Li-Fen Su, Ji-Bin Miao, Peng Chen, Jia-Sheng Qian, and You Shi*
College of Chemistry and Chemical Engineering, Key Laboratory of High-Performance Rubber and Products of Anhui Province, and Key Laboratory of Environment-Friendly Polymeric Materials of Anhui Province, Anhui University
*College of Polymer Science and Engineering, the State Key Laboratory of Polymer Materials Engineering, Sichuan University- 응고분석을 이용한 냉각환경에 따른 Poly(lactic acid)/Graphene 복합체의 비등온 결정 동역학에 대한 연구
The poly(lactic acid) (PLA)/graphene (GN) composites were prepared by solution blending. An in situ measurement technique was adopted to examine the non-isothermal crystallization of PLA/GN composites, which was different from the typical circumstances at constant cooling rate in DSC. The rheological properties of the samples were investigated, and the Carreau-A model was applied to non-linearly fit the rheological data. The non-isothermal crystallization kinetics and solidification behaviors at variant cooling rates were investigated using a modified version of Avrami equation by Jeziorny coupled with three-parameter model (TPM) and four-parameter model (FPM). Our findings showed that the viscosity of the PLA/GN composites dropped with increasing shear rate or GN content. Crystallization kinetic analysis suggested that GN served as an effective nucleating agent for PLA under non-isothermal melt crystallization conditions with variant cooling rate.
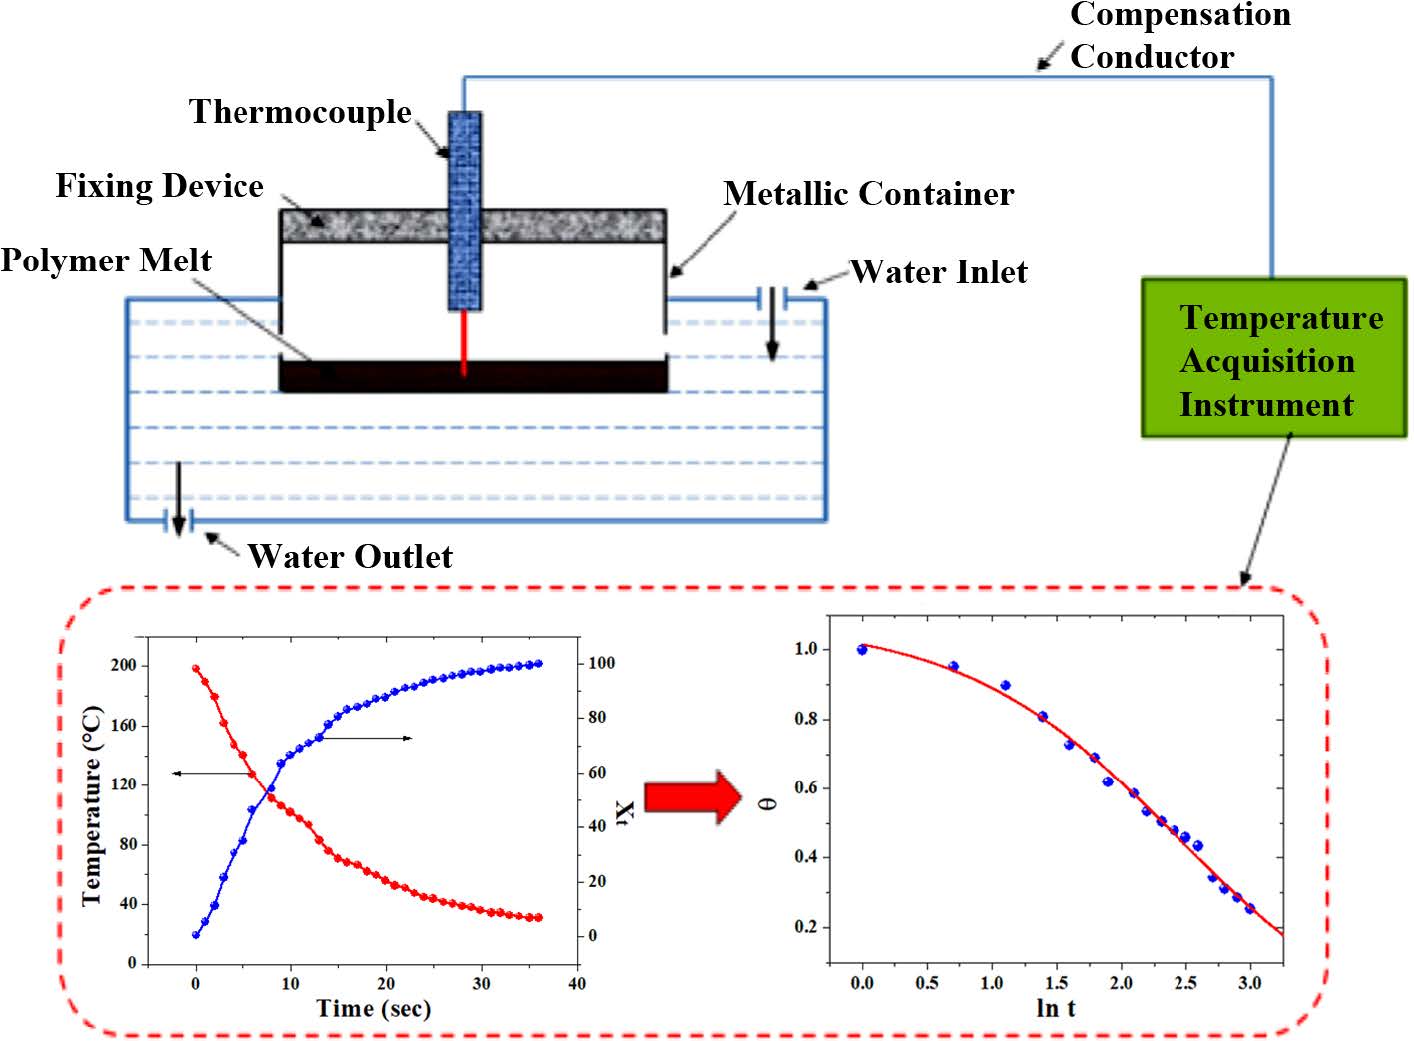
An in situ temperature measurement instrument was designed for examining the variation of temperature (also converted to crystallinity) as a function of elapsed time. The usage of fourparameter model (FPM) was proved to successfully interpret the evolution process of the temperature decay which would be applicable for forecasting the cooling time.
Keywords: poly(lactic acid), crystallization kinetics, nucleating agent, rheological properties, solidification
This authors thank the financial supports from the National Natural Science Foundation of China (Nos. 51203002, 51273001), the Research Fund for Doctoral Program of Higher Education of China (No. 2011340110003) and the “211 Project” (ZLTS2015059, 201510357142) of Anhui University are greatly appreciated. Besides, the authors are also indebted to Dr. L. Wang (University of Toronto) for his critical comments and suggestions of improving our work.
Poly(lactic acid) (PLA) has drawn intensive attentions in the last several decades as a well-recognized biodegradable environmental friendly and biocompatible materials.1,2 However, PLA was still limited to relatively narrow application areas, such as, food packaging industry,3 3D printing industry4 and biomedical applications,5 primarily due to some inferior mechanical properties (e.g., poor toughness,6 finite thermal resistance,7 etc.) and slow crystallization rate.8 Researches on the modification towards PLA materials have become one of the key issues in recent years.9
The mechanical properties, degradation performance and thermal stability of PLA are directly related to the crystallization behavior of PLA.10 In order to improve the crystallization kinetics of PLA, many researchers have carried out extensive studies in recent few decades. In the study by Zhen et al.,11 PLA/ZnO pillared organic saponite nanocomposites were prepared by melting processing. Their results demonstrated that ZnO pillared organic saponite had a good interfacial heterogeneous nucleation effect in PLA matrix, and also played an active role in accelerating the crystallization process of PLA. Yue et al.12 studied the influence of chemical modified microfibrillated cellulose (MMFC0 on crystallization behavior and mechanical properties of PLA, and even small amount of MMFC (ca. 3 wt%) could improve the tensile modulus and tensile strength by 25% in comparison to neat PLA. Girdthep et al.13 used graphene nanoplatelets as NA for PLA, and found that an optimal graphene content (0.5 phr) showed a most pronounced effect in facilitating PLA’s crystallization. Orellnan et al.14 prepared the PLA/amine-modified silica nanocomposites, and found that the crystallization rate of PLA was significantly increased after the addition of silica. Kamal et al.15 studied the crystallization kinetics of PLA filled with cellulose nanocrystals (CNC), and found that the PLA/CNC composites showed a high nucleation density, smaller spherulitic dimension, and higher crystallization rate than neat PLA. Similar phenomenon was also observed by Petchwattana et al.,16 who studied the effect of talc with different particle sizes on the crystallization kinetics of PLA, and discovered that smaller particles of talc were favorable for faster crystallization rate. Park et al.17 investigated the effect of carbon nanotube (CNT) on PLA as the nucleating agent, and found that the crystallization kinetics of PLA were significantly enhanced in the presence of CNTs, which further resulted in remarkable enhancement in the mechanical properties of the PLA/CNT nanocomposites even with a very small amount of CNTs.
These previous work11-17 suggested that it is an effective way to control the crystallization behavior of PLA through the usage of nano-fillers. Graphene (GN) is a well-known promising nano-filler material owing to its unique microscopic structure, large specific surface area18 and so on, which was recently widely adopted to modify a variety of polymers to improve their mechanical, electrical and thermal properties.19-22 For instance, Abbasi et al.23 found that graphene-reinforced polyetherimide (PEI) foam presented higher thermal stabilities and higher values of storage modulus than unfilled PEI foam. The nanocomposite foam filled with 2.2 vol% GN showed a dramatic increase in the electrical conductivity.
The present work was aimed at studying the effect of GN upon PLA’s non-isothermal crystallization process during a cooling period close to industrial processing operations (quite close to the real processing situations, e.g., injection and compression molding operations), which provides a facile method for studying the melt non-isothermal crystallization kinetics of slowly crystallizing polymers (e.g., poly(ethylene terephthalate), PLA, etc.) as compared to traditional methods for crystallization kinetic analysis24 (typically, DSC,25 XRD, etc). Based upon the crystallization kinetics analysis regarding the effect of GN content on the crystallization process of PLA with the GN loading from 0.5% to 2.0% using DSC,26 the melt crystallization kinetics of PLA in the presence of GN was investigated under variant cooling circumstances and GN was found to serve as an effective nucleating agent (NA) for PLA.
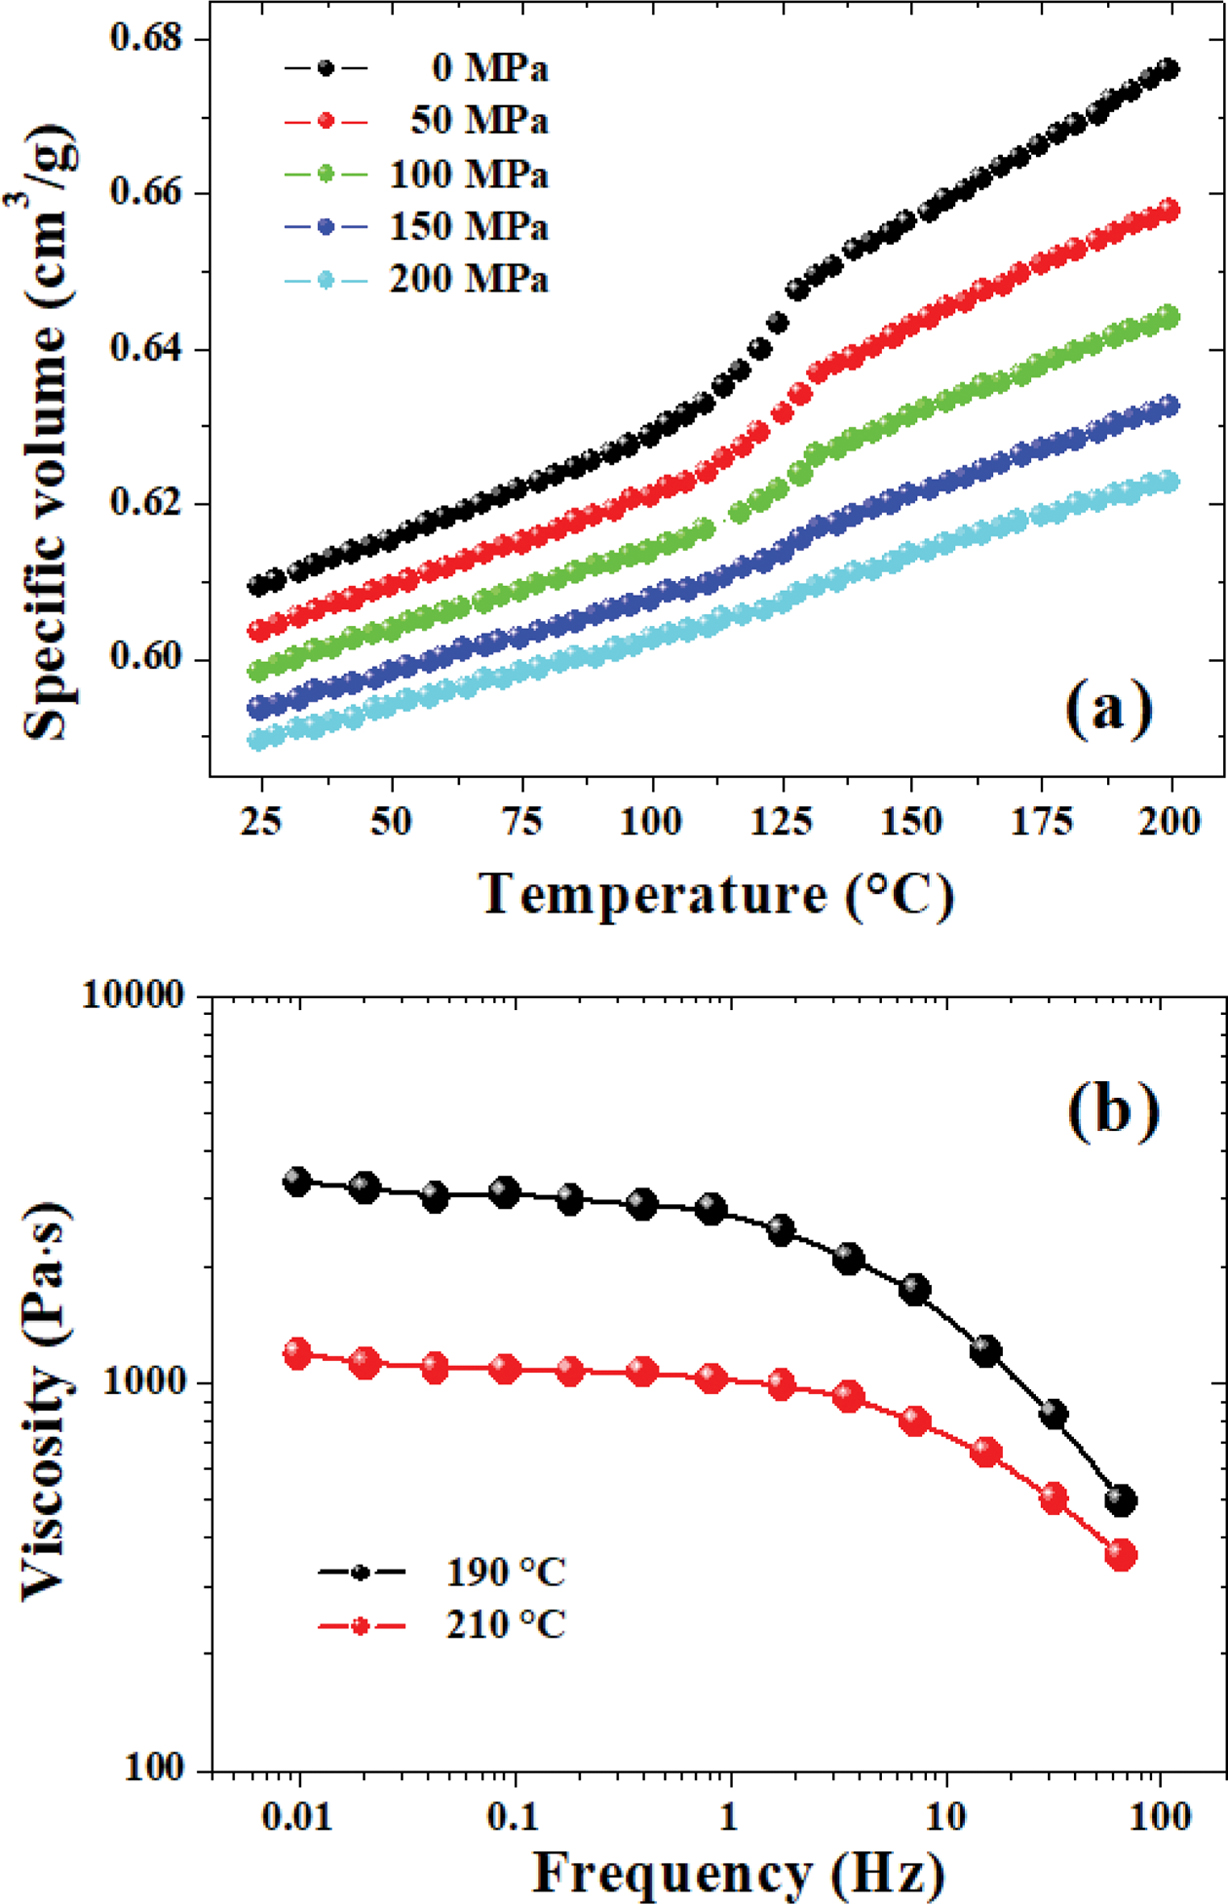
41,42Materials. In this work, poly(lactic acid) (PLA), model: ECOLAS-1010, was kindly supplied by Kao Co., Japan, with a density of 1.252 g/cm3. Figure 1(a) showed the P-V-T curves of the PLA material, which was plotted based upon the 2d-Tait equation27 with the material parameters provided by the manufacturer. The relative crystallinity of the samples was calculated based upon the density variations from the P-V-T relationship (as shown later). Pristine graphene (SGNP-F01005), with a bulk density of 0.065 g/mL, was kindly provided by the SCF Nanotech Co., Ltd., China, with an average grain size of 5 mm and an average thickness of 5 nm.
Experimental Procedures. Sample Preparation: The PLA/GN composites were prepared by solution blending. Firstly, PLA was dissolved in N,N-dimethylformamide (DMF) at a concentration of 100 mg/mL at 70 ℃ for 2.5 h. Meanwhile, put GN into the DMF to prepare a suspension liquid with a GN concentration of 1 mg/mL, which was placed in an ultrasonic dispersion machine (model: PS-30, SuperArt Tech. Co., China) at a frequency of 40 kHz for 2 h to ensure that GN was dispersed evenly. Then mixed the GN suspension liquid with the solution of PLA, and stirred at 65 ℃ for 4 h. Subsequently, placed the mixture in the ultrasonic dispersion machine and mixed for 10 min. After that, the mixture was poured into a watch-glass to stir for volatilization. The samples were prepared after the solvent was completely volatilized. The contents of GN in the prepared PLA/GN composites were 0, 0.5 and 1.0 wt%, respectively.
Rheological Property Characterization: The dynamic rheological measurements were characterized in a stress-controlled rheometer (model: Bohlin Gemini-HR nano, Malvern Instruments Ltd., U.K.) using a 25-mm-parallel-plate geometry. Dynamic mechanical tests were performed at 190 and 210 ℃ with frequency ranging from 0.01 to 100 Hz. In order to measure the linear viscoelastic of the samples, the strain of dynamic frequency was set as 1.0%.
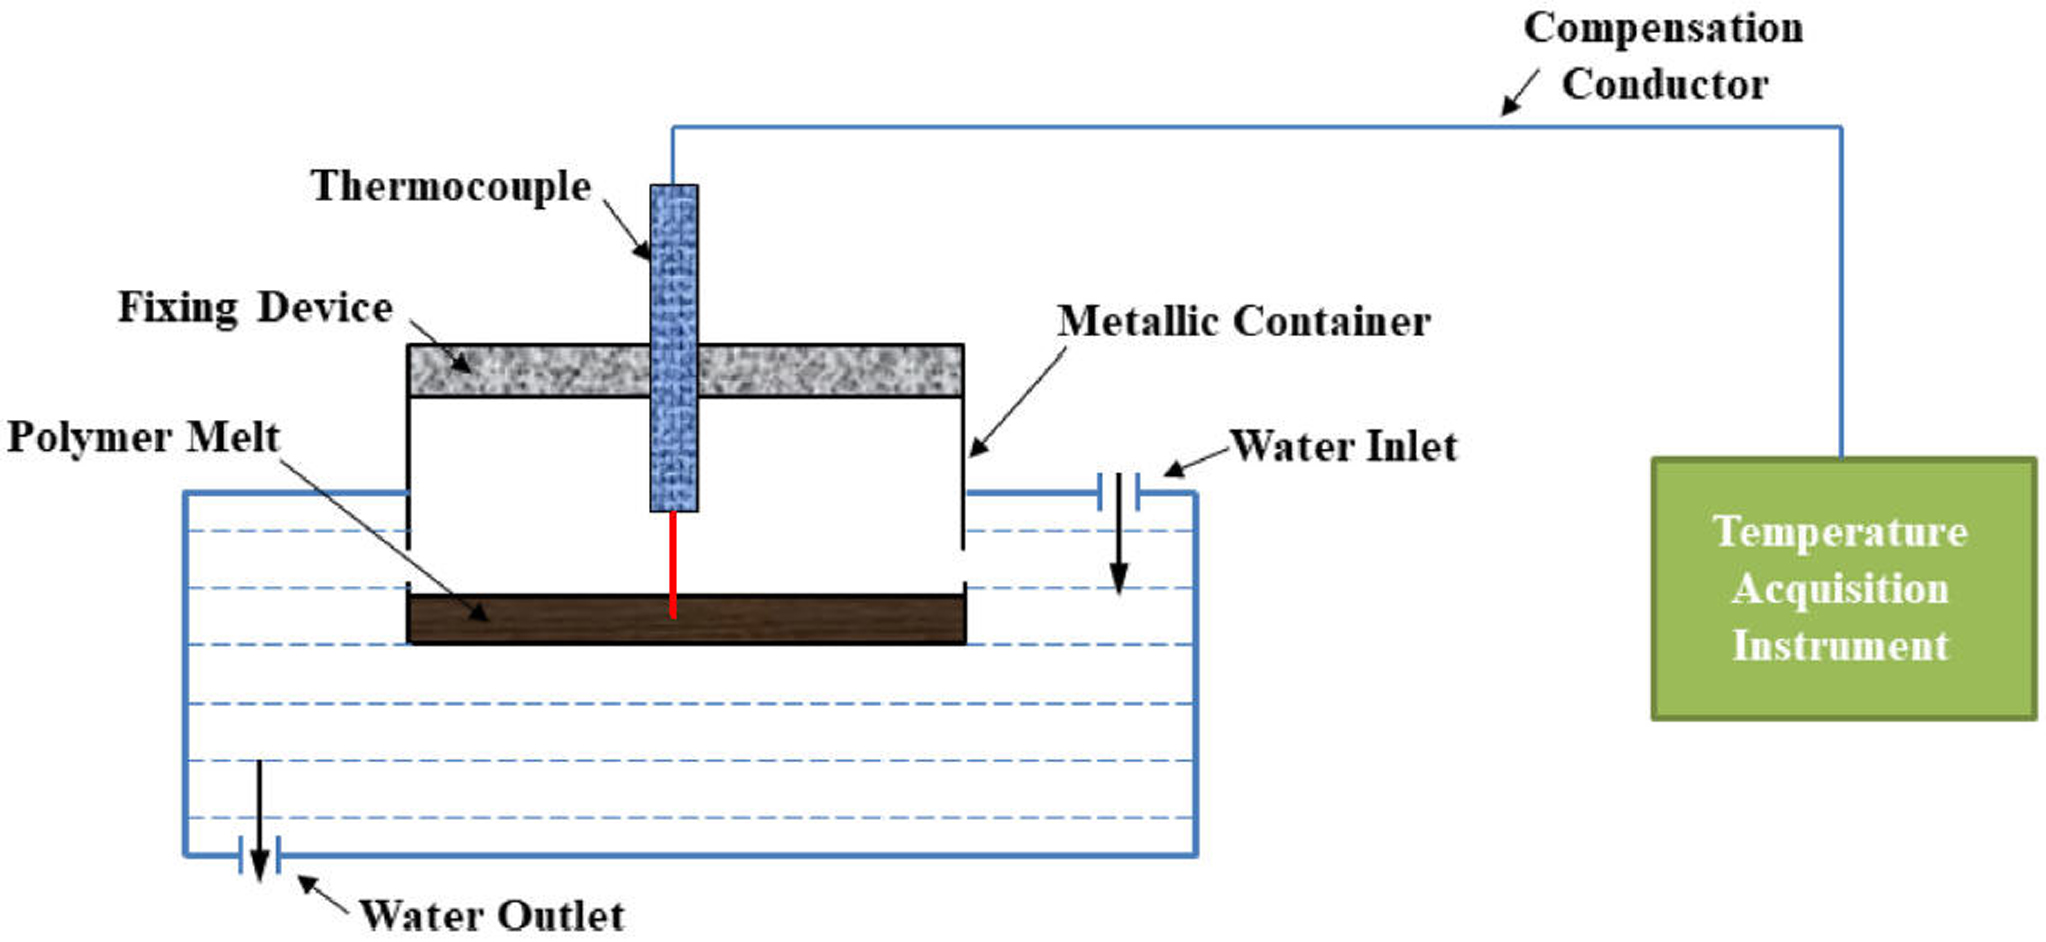
In Situ Measurement of Solidification Behavior: In this study, a micro-thermocouple (model: WRTK-192, Ode Precision Instrument Co., China) was used to record the temperature decay during the cooling process of the prepared samples. The micro-thermocouple was fixed on top of a specially-designed metallic container with its tip inserted into the molten samples at specific depth. The samples were initially heated to 250 ℃ by a hot-stage (model: 946A, Youyue Seiko Co., China), then the metallic container was quickly immersed into the cold water to cool the samples to the room temperature. The temperature decays during the entire cooling period was recorded by a data acquisition system (model: LU-R2100, Anthone Electronics Co., China) with a sampling time of 1.0 s. The experimental set-up used in this work is designed by our lab,28 and can be illustrated in Figure 2.
|
Figure 1 P-V-T relationship (a); viscosity curves measured at 190 ℃ and 210 ℃ (b) for neat PLA. |
|
Figure 2 Schematic of experimental set-up for in situ measurement device. |
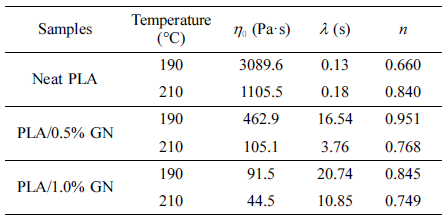
The relationship of viscosity versus frequency of neat PLA under different temperatures was shown in Figure 1(b). It can be seen that the shear viscosity dropped continuously with increasing frequency, which was deemed as the “shear thinning” phenomenon, indicating the characteristics of obvious pseudo-plastic fluid of the PLA melt. The Carreau-A model was applied in this work to fit the rheological data of the PLA material29:

where η* is the complex viscosity, η0 is the zero-shear viscosity, γ is the shear rate, and λ is the characteristic relaxation time. Here, n indicates the non-Newtonian exponent. Using the nonlinear fitting, all parameters was obtained and listed in Table 1 (all data have gone through several rounds of repetition). The viscosity drops with increasing GN% and temperature for all samples. As for the relaxation time (λ), the λ value of the PLA composites displayed a decreasing trend as a function of increasing temperature, considering that higher temperature always leads to higher motion ability of the macromolecular chains. However, the λ value of neat PLA displayed a different trend from the composites, which should be further investigated in our on-going work.
According to the Arrhenius equation towards temperature dependence,30

There existed a linear relationship between ln η and 1/T, so the viscosity of the polymer dropped with increasing temperature.
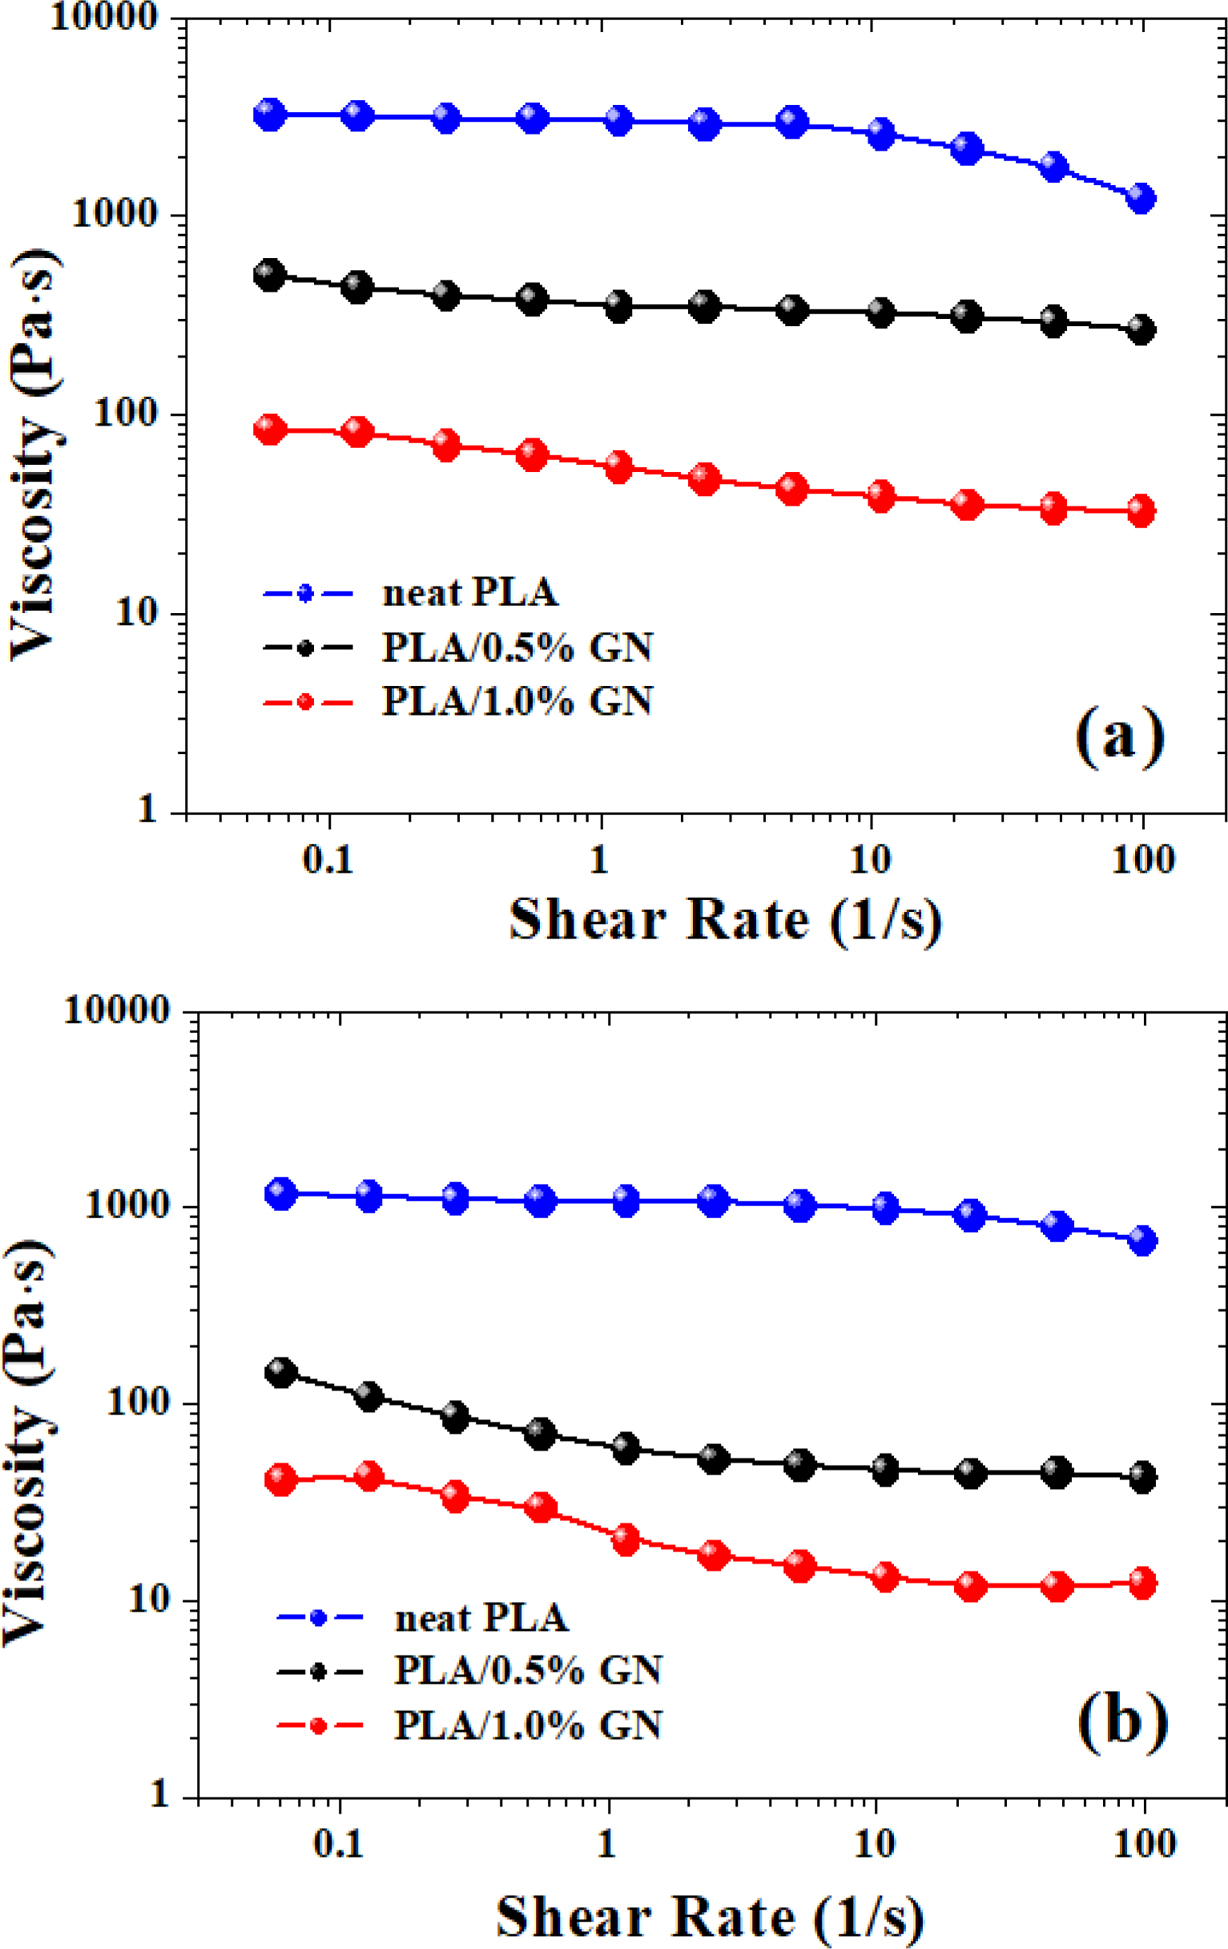
Figure 3 showed the plots of viscosity vs. shear rate for PLA and PLA/GN composites at 190 and 210 ℃ through dynamic rheological tests. As can be seen from Figure 3, the viscosity of the PLA/GN composites were a bit lower than neat PLA, and with the increase of the GN content, the viscosity of the PLA/GN composites were reduced, which suggested that the addition of GN could improve the processability of PLA to some extent. As is known, GN is a special nano-particles with unique configuration, and has large specific surface area as well as high activity, which can form an excellent chemical and physical connection with the PLA matrix. This kind of interface binding effect will reduce the molecular chain’s flexibility and lower its entanglement density, leading to reduced apparent viscosity.26 Additionally, as the chains of PLA tended to get entangled, GN could fill in the free volume between the molecular chains, which presented some “rigidity” so that it’s easier for the melt to flow.31 As for this issue, a very similar phenomenon was also observed by Cipriano et al.32 in their studies on PLA/talc composites.
The relative crystallinity of a polymer can be practically calculated by the equation as follows,

where Va and Vc meant the specific volumes of the 100% crystallized and amorphous phases of PLA, respectively. In this work, the values of Vc and Va of PLA are 0.799 cm3/g and 0.932 cm3/g, respectively. The value of V was obtained from Figure 1(a) since the temperature and pressure were known.
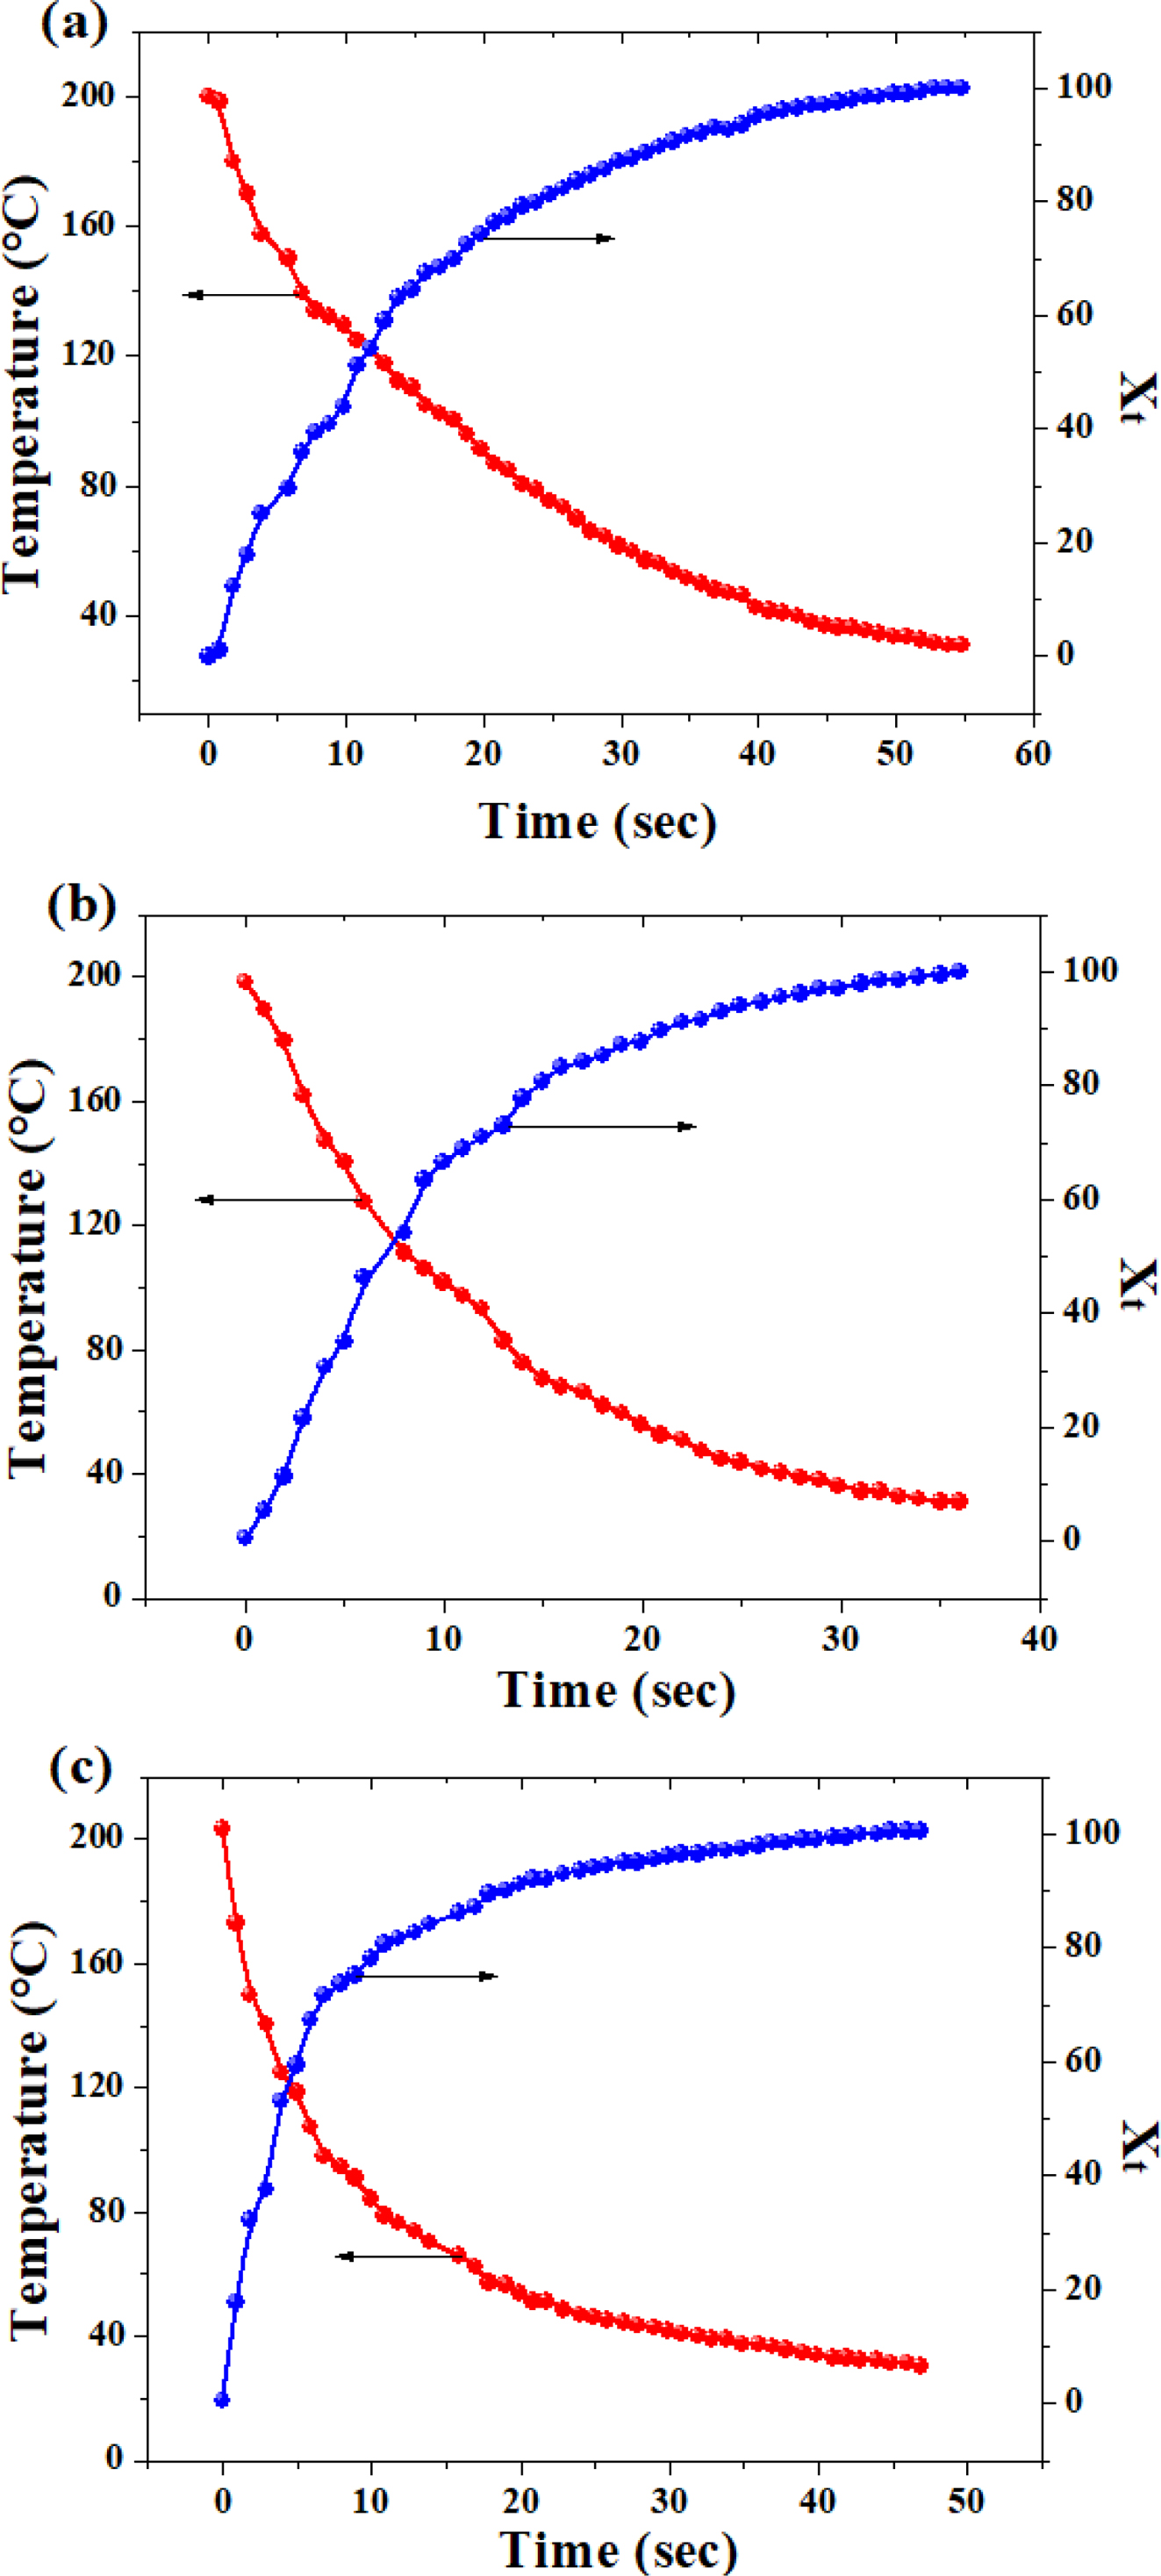
Figure 4 showed the variations of temperature and crystallinity with the crystallization time.
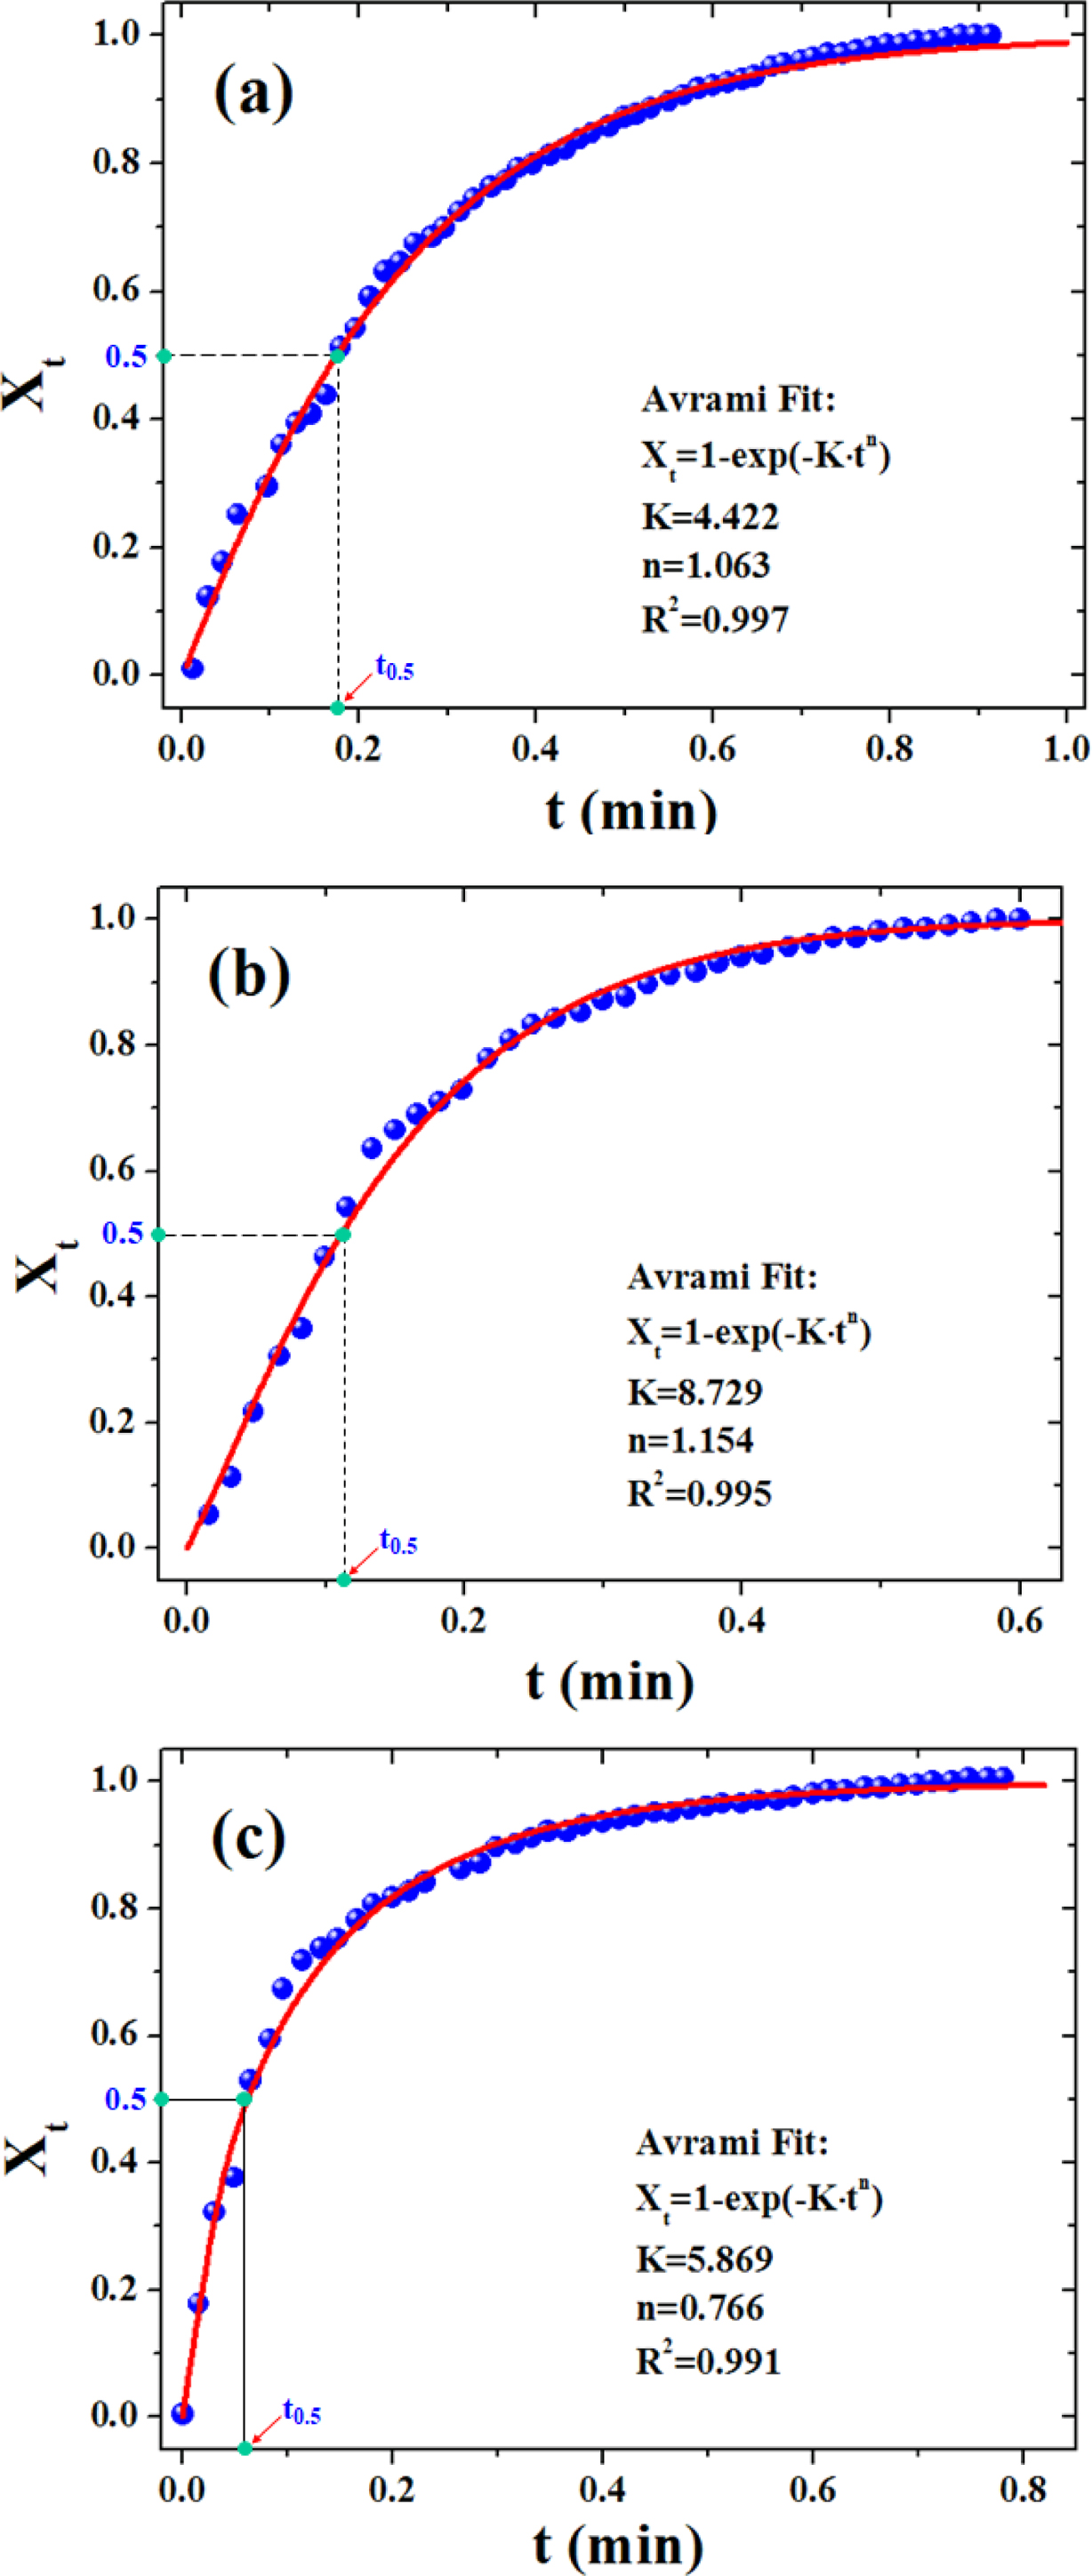
It can be seen that the temperature of the polymer dropped with the elapsed time, while its crystallinity increased gradually. Both kinds of curves took the shape of an “arc” with a leveling-off in the later stage. Compared with our previous work, there is no apparent “phase-change platform” that can be seen,27 which is because the temperature drop was quite fast, leading to considerable decrease in the time span of the crystallization process. Figure 5 presents the Avrami curve fitting of the Xt versus crystallization time, with the crystallization half time (t0.5) labeled in the plots which is generally used as a measure of overall crystallization rate (cf. Table 2). Interestingly, there existed a linear correlation between (t0.5)-1 and GN% as follows:

According to Table 2, with increasing GN content, (t0.5)-1 of the samples rose linearly. That is to say, the crystallization rate of the composites was accelerated with the addition of GN, and this effect could be strengthened with a further increase of the GN content, indicating that the presence of GN could promote a heterogeneous nucleation for PLA33 since GN provided a number of new nucleation sites, reduced the activation energy of crystal formation.34 Based on the foregoing research on dynamic rheological study of PLA and its composites with GN, it was clearly seen that when the GN content was small, the viscosity of the composite materials decreased with the increase of the filler’s content, which enhanced the mobility of the molecular chains and was in favor of the crystallization process of PLA.35
As is known, the isothermal crystallization kinetics of the samples can be evaluated using the Avrami equation36:

where Zt is the crystallization rate constant, and n is the Avrami exponent related to the mechanism involved crystal nucleation and growth of crystalline phases. The above equation can be converted to the following form, which was first proposed by Jeziorny,26,37-39

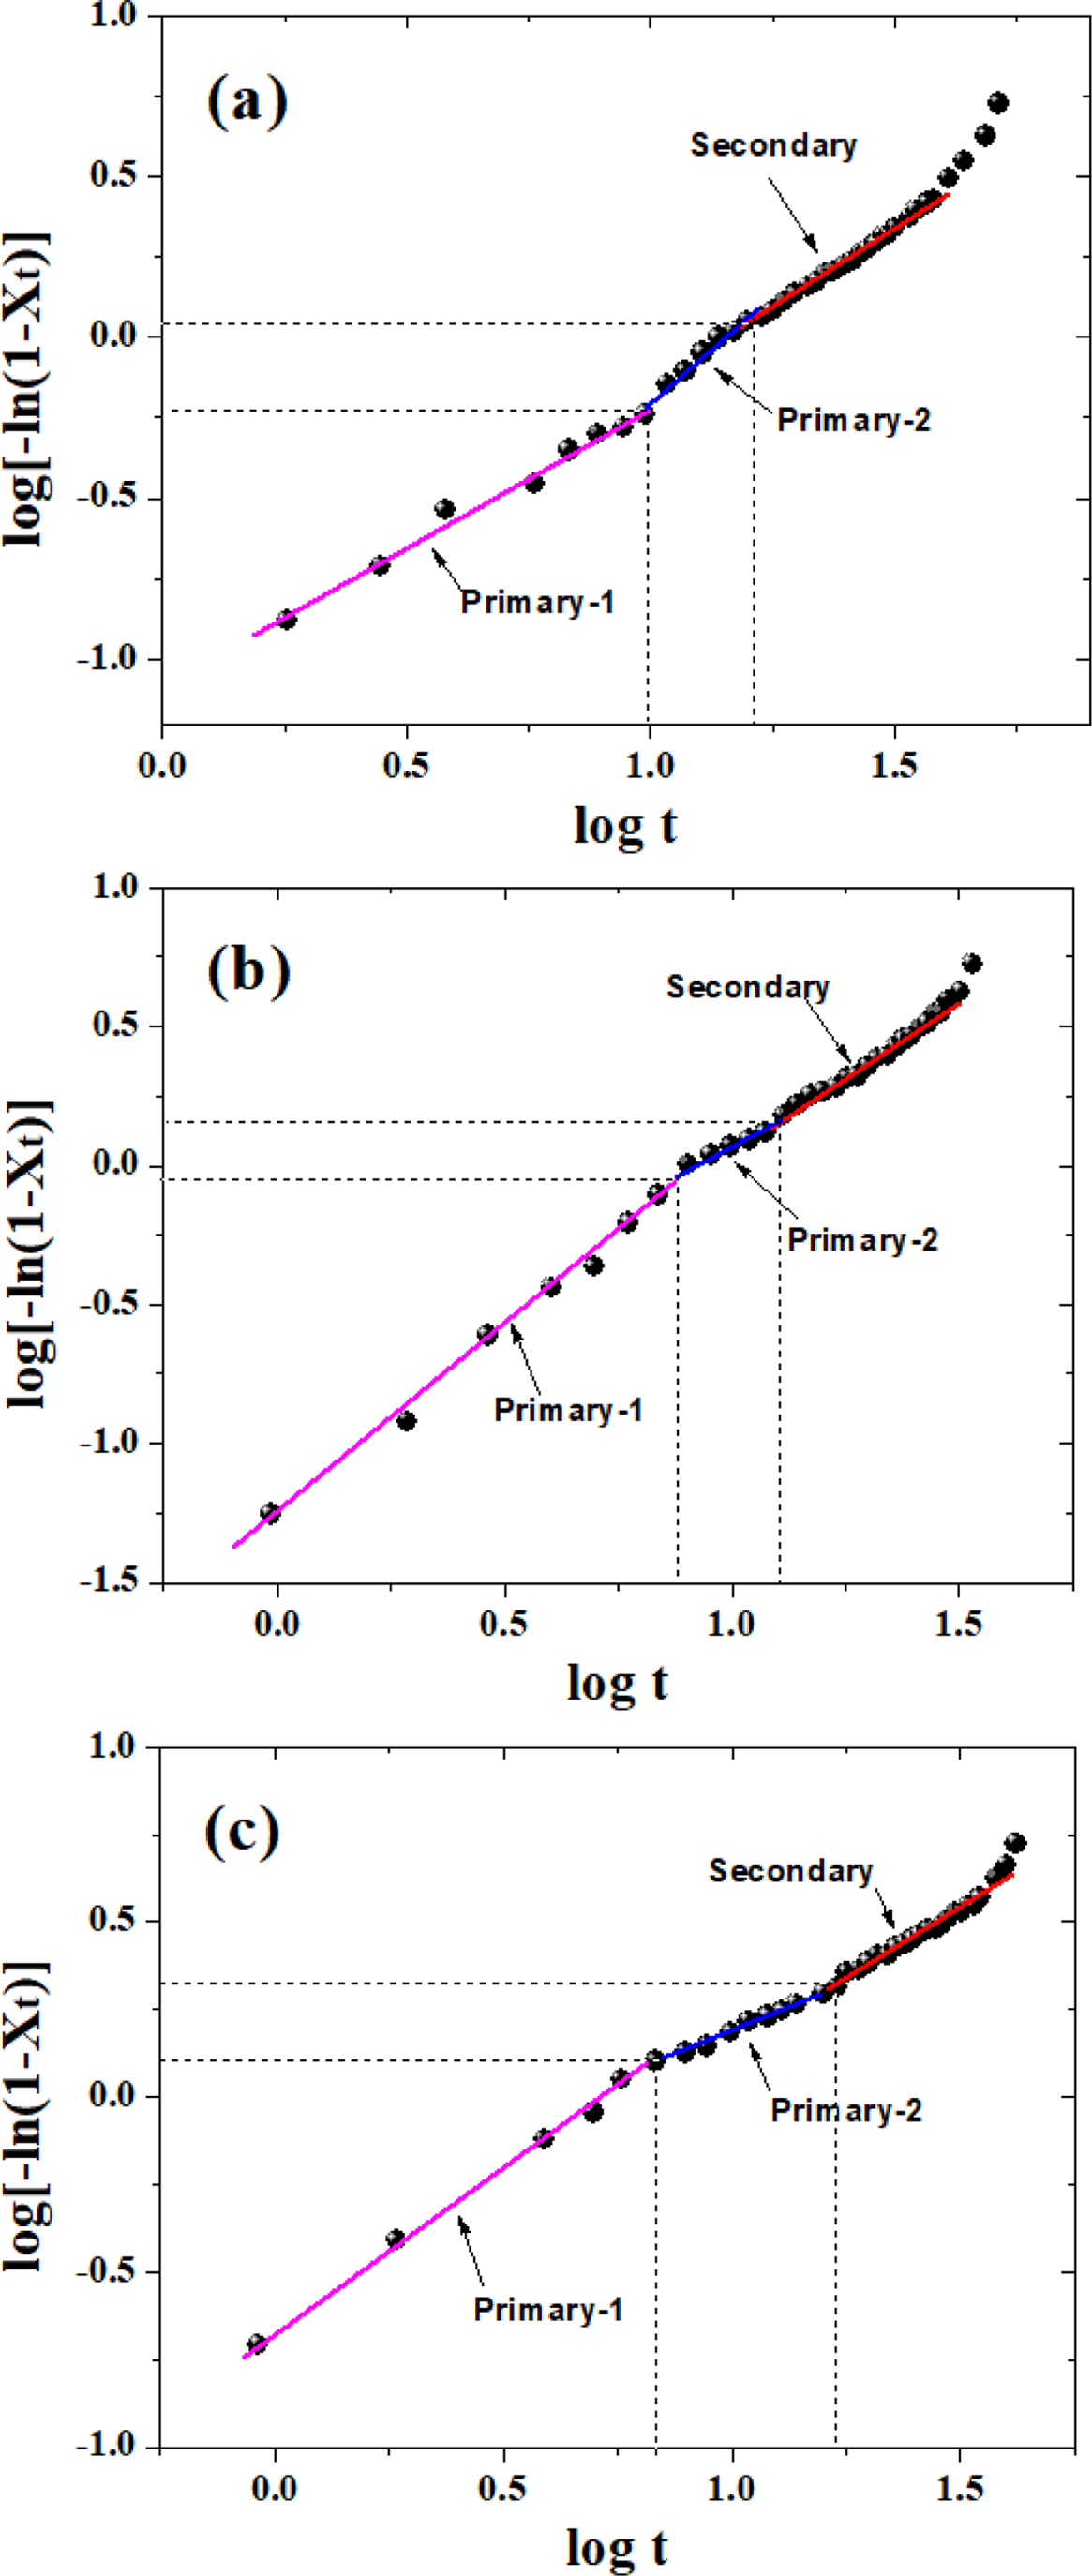
Figure 6 shows that plots of log[-ln(1-Xt)] versus log t for various samples. Obviously, the crystallization of PLA and its composites occurred through two main stages (i.e., primary and secondary crystallization processes). However, the primary crystallization also consisted of two segments, and this type of complex crystallization was also reported in previous literature.40 For a particular sample, the fitting lines for each segment are approximately parallel to each other, indicating a similar nucleation mechanism and crystal growth geometries at different cooling rates for the samples. During the first stage of the primary crystallization, the values of n for all the samples lie within 0.8 < n < 1.4 (cf. Table 2). During the second stage, the value of n increased for neat PLA but decreased for PLA/GN composites, which may correspond to either a very complex crystallization process or to the growth of smaller crystallites. During the secondary crystallization process, all n values remain within 2, indicating that the crystallization process concludes with a two-dimensional growth of particles. As the GN% increased, the value of crystallization rate Zt increased, indicating GN could help to improve the crystallization rate. This is in agreement with the results of t 0.5 (cf. Table 2), which suggests that GN could offers a more specific area for PLA to crystallize under the non-isothermal conditions. It is noted that there still exists a doubt that as compared with neat PLA, Zt1a value for PLA/0.5%GN sample is low, which requires an on-going study in our group.
In this work two nonlinear empirical models of three-parameter and four-parameter models are utilized, which have recently been raised in our research group for the transient heat conduction mechanisms of crystalline polymers,41-42 namely, “TPM” and “FPM,” respectively. The TPM can be expressed in the following form:

where A and B were the parameters determined by the initial temperature (T0) and the cooling medium temperature (Tw), respectively. Parameter C was closely related to the molecular properties of polymers (i.e., composition, filler content, chain branching structures, etc). For better understanding the influence exerted by the locations on the heat conduction, a position dependent coefficient “D” in FPM was defined:

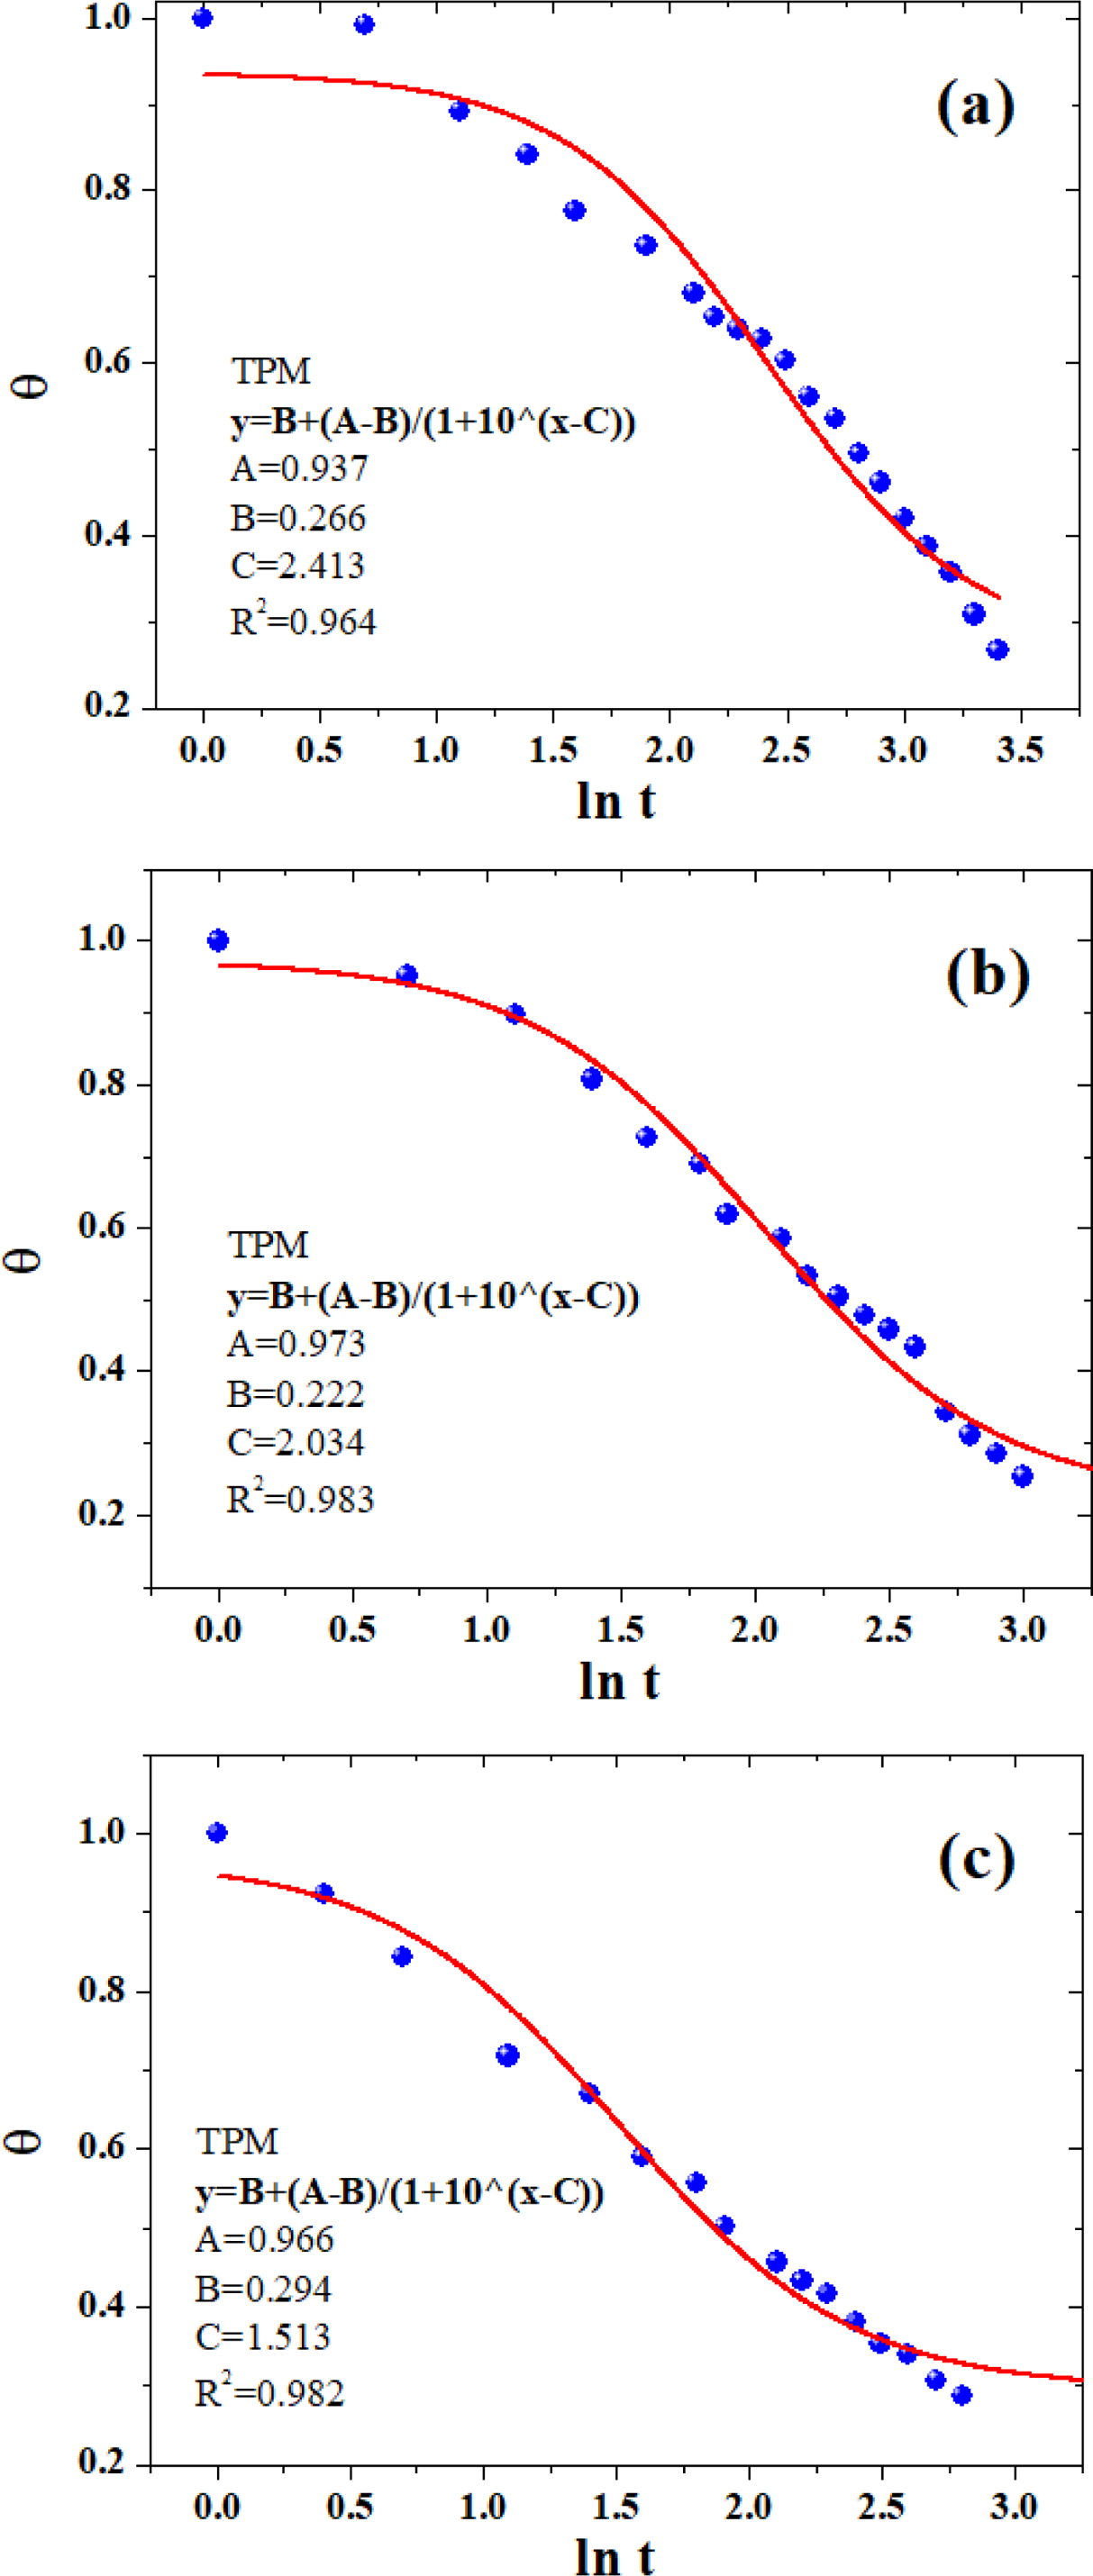
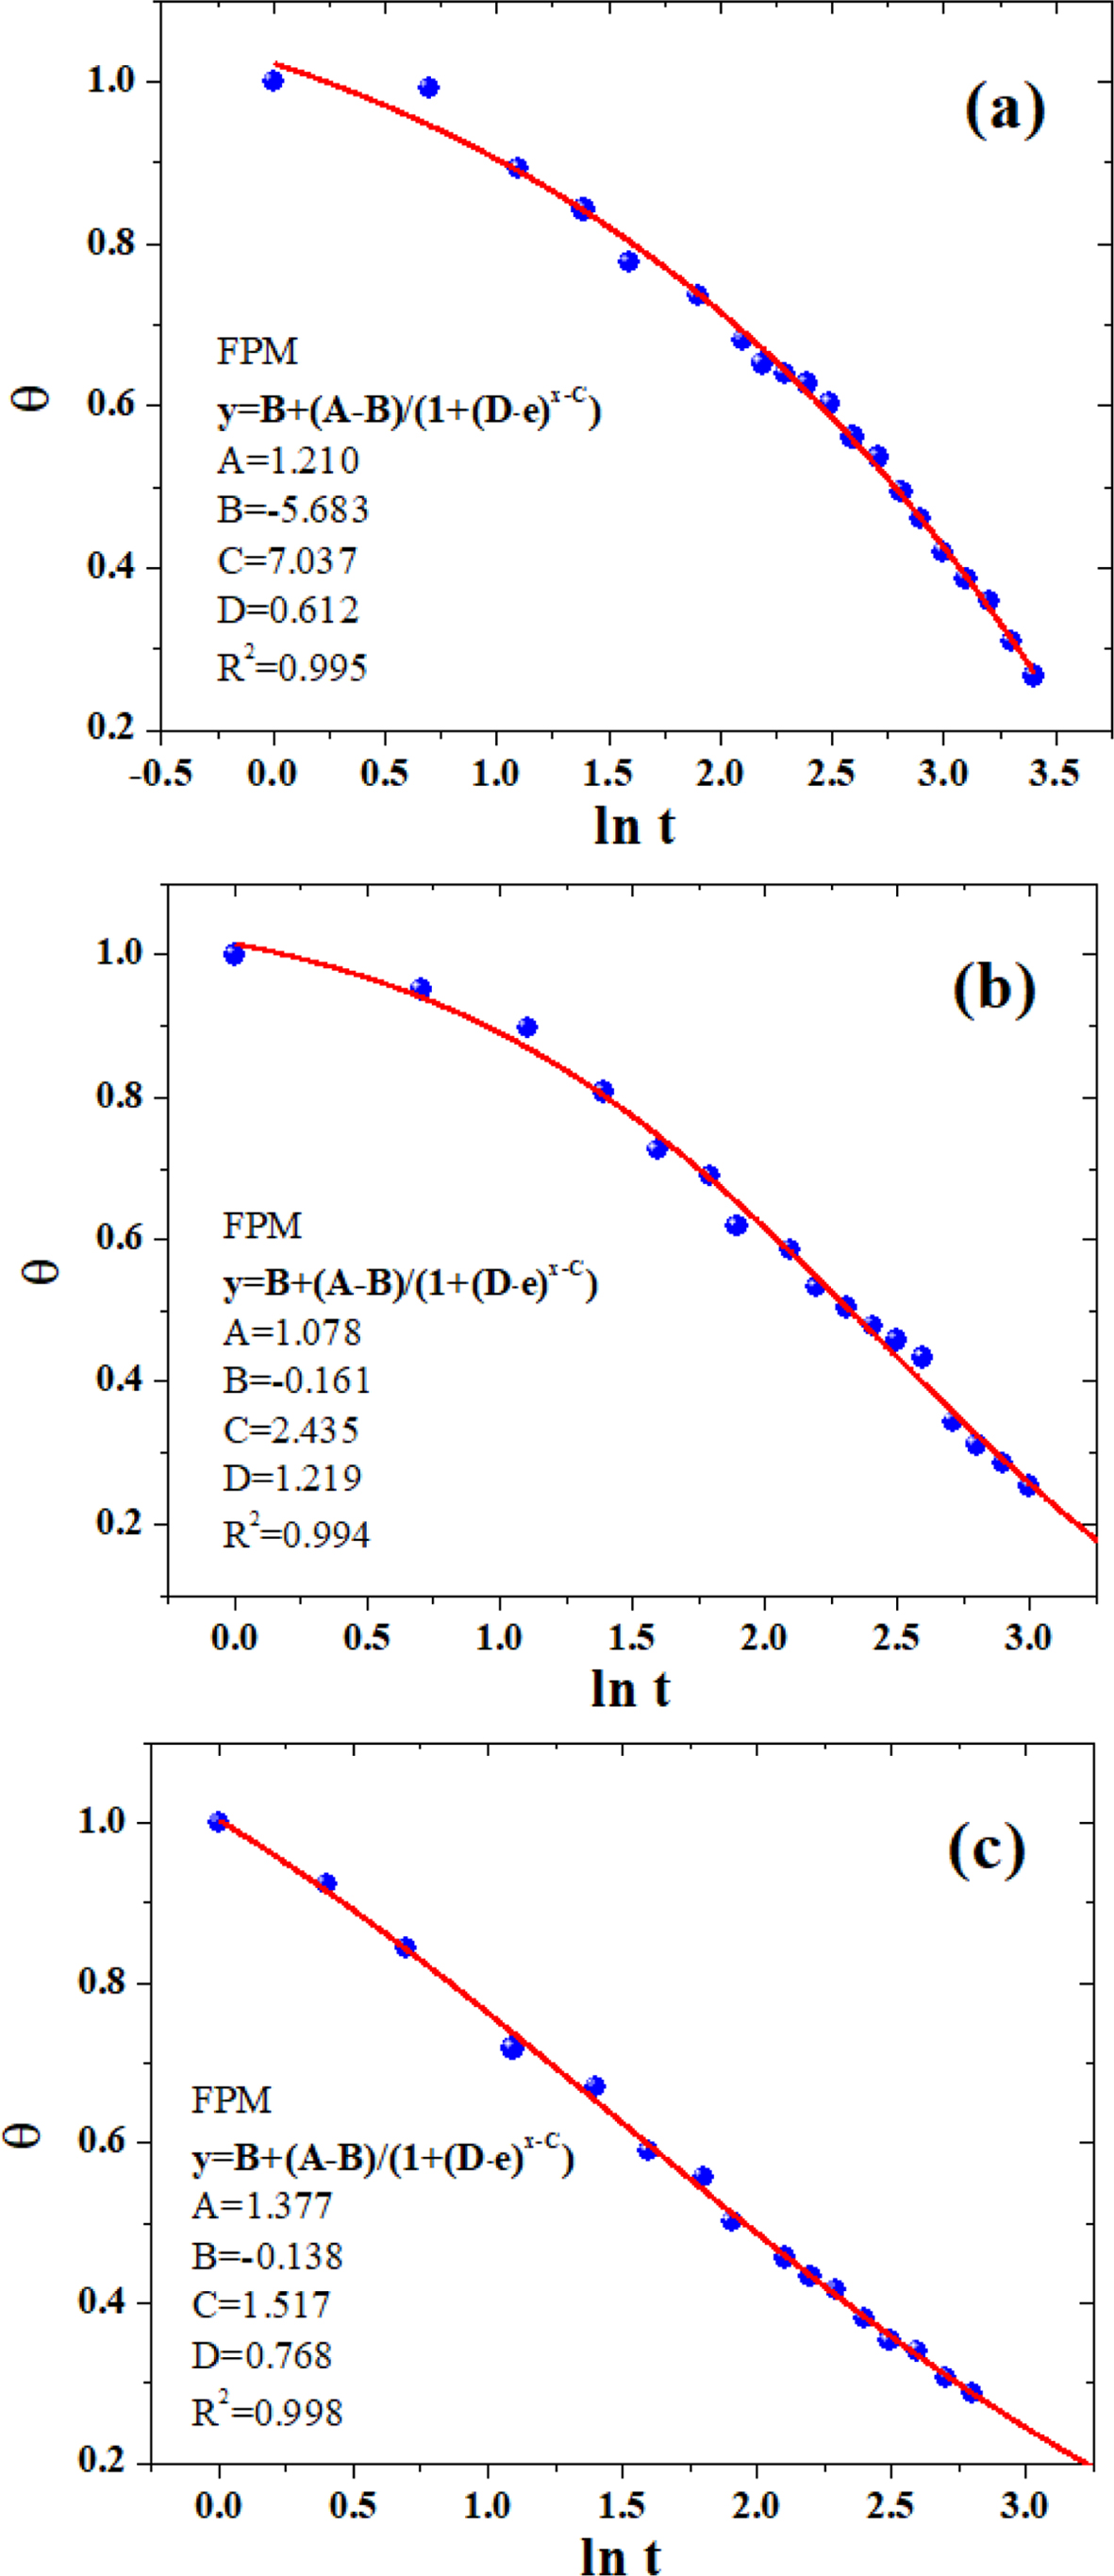
The parameters A, B, and C were similar to those defined earlier in eq. (9), and parameter D was the position-dependent coefficient. Figures 7 and 8 showed the non-linear curve fitting of dimensionless temperature (θ) versus lnt using TPM and FPM, respectively. All fitting parameters and the corresponding regression coefficient (R2) are listed in Table 3. Generally, the models could reasonably give the prediction of the temperature decay. FPM obviously presented even better fitting results,43-44as judged from the R2 values (cf. Table 3). In spite of the fact that the models are actually a phenomenological description of the phase-change behavior of crystalline polymers, the incorporation of latent heat and position corrections to FPM could better reflect the kinetic nature of crystallization process for of crystalline polymers (e.g., PE, PP, PLA, PET, etc.)
|
Figure 3 Comparison of shear rate dependence of viscosity of PLA and PLA/GN composites measured at 190 ℃ (a); 210 ℃ (b). |
|
Figure 4 Variation of temperature and relative crystallinity (Xt) as a function of time: (a) neat PLA; (b) PLA/0.5%GN; (c) PLA/1.0%GN. |
|
Figure 5 The Avrami curve fitting of the experimental Xt versus crystallization time: neat PLA (a); PLA/0.5%GN (b); PLA/1.0%GN (c). Here “t0.5” denotes the crystallization half time. |
|
Figure 6 Plot of log[-ln(1-Xt)] versus log t: (a) neat PLA; (b) PLA/0.5%GN; (c) PLA/1.0%GN. |
|
Figure 7 The non-linear curve fitting of dimensionless temperature (θ) versus ln t using TPM: (a) neat PLA; (b) PLA/0.5%GN; (c) PLA/1.0%GN. |
|
Figure 8 The non-linear curve fitting of dimensionless temperature (θ) versus lnt using FPM: (a) neat PLA; (b) PLA/0.5%GN; (c) PLA/1.0%GN. |
|
Table 2 Crystallization Kinetic Parameters Including Primary and Secondary Stages |

|
Table 3 Kinetic Parameters Obtained via Non-linearly Fitting with TPM and FPM, Respectively |

In this work, the PLA/GN composites with various GN contents were prepared through solution blending method, which ensured a better dispersion of GN in the matrix. The dynamic rheological measurements disclosed that the shear viscosities of the PLA and PLA/GN composites dropped gradually along with the increase of shear rate or increasing GN content. The melt non-isothermal crystallization kinetics was characterized based upon our solidification analysis, and our results showed that GN played a good role as a nucleating agent. The crystallization rate of the PLA/GN composites rose with increasing GN content. The temperature dependence of relative crystallinity (Xt) during the primary and secondary crystallization stages for PLA and PLA/GN composites was generalized as the empirical equations, which can be adopted to predict the Xt with the variation of temperature. In addition, the three-parameter model proposed by our group was used to obtain the cooling parameters A, B and C via non-linearly curve fitting technique, which is applicable in the forecast of melt non-isothermal crystallization as well as the optimization of cooling time during the injection molding operations.
- 1. X. M. Zhu, R. Huang, T. Zhong, and A. J. Wan, Polym. Korea, 39, 889 (2015).
-

- 2. M. Barczewski and O. Mysiukiewicz, Polym. Korea, 42, 267 (2018).
-

- 3. H. M. Kang, Y. Shin, and D. S. Kim, Polym. Korea, 42, 649 (2018).
-

- 4. M. Nerkar, J. A. Ramsay, B. A. Ramsay, and M. Kontopoulou, Macromol. Mater. Eng., 299, 1419 (2014).
-

- 5. E. Fortunati, F. Luzi, D. Puglia, R. Petrucci, J. M. Kenny, and L. Torre, Ind. Crop. Prod., 67, 439 (2015).
-

- 6. K. S. Stankevich, A. Gudima, V. D. Filimonov, H. Kluter, E. M. Mamontova, S. I. Tverdokhlebov, and J. Kzhyshkowska, Mater. Sci. Eng., 51, 117 (2015) .
-

- 7. V. T. Phuong, M. B. Coltelli, and P. Cinelli, Polymer, 55, 4498 (2014).
-

- 8. J. H. Kim, Polym. Korea, 41, 735 (2017).
-

- 9. M. Driskens, R. Peeters, and J. Mullens, J. Polym. Sci., Part B: Polym. Phys., 7, 2247 (2009).
-

- 10. N. Najafi, M. C. Heuzey, and P. J. Carreau, Polym. Eng. Sci., 53, 1053 (2013).
-

- 11. W. J. Zhen and J. L. Sun, Polym. Korea, 38, 299 (2014).
-

- 12. Z. B. Yue, B. Yang, and H. Wang, Polym. Bull., 75, 3377 (2018).
-

- 13. S. Girdthep, W. Sankong, A. Pongmalee, T. Saelee, W. Punyodom, P. Meepowpan, and P. Worajittiphon, Polym. Test., 61, 229 (2017).
-

- 14. J. L. Orellana, M. Mauhar, and C. L. Kitchael, J. Renew. Mater., 4, 3409 (2016).
-

- 15. M. R. Kamal and V. K. Hoshkava, Carbohydr. Polym., 123, 105 (2015).
-

- 16. N. Petchwattana, S. Covavisaruch, and S. Petthai, Polym. Bull., 71, 1947 (2014).
-

- 17. S. H. Park, S. G. Lee, and S. H. Kim, A: Appl. Sci. Manufact., 46, 11 (2013).
-

- 18. A. W. Anwar, A. Majeed, and N. Iqbal, J. Mater. Sci. Technol., 31, 699 (2015).
-

- 19. J. T. Kim, H. J. Jeong, H. C. Park, and H. M. Jeong, Funct. Polym., 88, 1 (2015).
-

- 20. M. Seong and D. S. Kim, J. Appl. Polym. Sci., 132, 42269 (2015).
-

- 21. A. Almajid, L. Sorochynska, K. Friedrich, and B. Wetzel, Plast. Rubber Compos., 44, 50 (2015).
-

- 22. C. E. Corcione, F. Freuli, and A. Maffezzoli, Polym. Eng. Sci., 53, 531 (2013).
-

- 23. H. Abbasi, M. Antunes, and J. I. Velasco, Polym. Lett., 9, 412 (2015).
-

- 24. R. N. Jana and C. Im, J. Polym. Anal. Ch., 14, 418 (2009).
-

- 25. Z. B. Song and W. J. Zhan, Polym. Korea, 41, 902 (2017).
-

- 26. R. Xia, M. M. Sun, B. Yang, J. S. Qian, P. Chen, M. Cao, J. B. Miao, and L. F. Su, Polym. Korea, 42, 230 (2018).
-

- 27. B. Yang, J. Z. Lin, and R. Xia, J. Macromol. Sci., Part B: Polym. Phys., 53, 672 (2014).
- 28. L. Hu, B. Yang, Y. L. Deng, F. X. Lu, Z. Z. Zheng, J. B. Miao, J. S. Qian, C. R. Zhang, P. Chen, and Y. C. Zhang, Polym. Korea, 41, 569 (2017).
-

- 29. M. S. Chun and M. J. Ko, J. Korean Phys. Soc., 61, 1108 (2012).
-

- 30. V. M. Karbhari and M. A. Abanilla, Composites Part B, 38, 10 (2007).
-

- 31. D. Pedrazzoli, A. Pegoretti, R. Thomann, and J. Kristof, Polym. Compos., 36, 869 (2015).
-

- 32. T. F. Cipriano, A. L. N. Silva, A. H. M. F. T. Silva, A. M. F. Sousa, G. M. Silva, and M. C. G. Rocha, Polimeros., 24, 276 (2014).
-

- 33. S. Saeidlou, M. A. Huneault, H. Li, and C. B. Park, Polymer, 54, 5762 (2013).
-

- 34. R. Deepachitra, R. Nigam, and S. D. Purohit, Mater. Manuf. Process., 30, 804 (2015).
-

- 35. S. Barrau, C. Vanmansart, and M. Moreau, Macromolecules, 44, 6496 (2011).
-

- 36. B. Yang, M. B. Yang, and W. J. Wang, Polym. Eng. Sci., 52, 521 (2012).
-

- 37. B. Yang, Y. L. Deng, R. Xia, J. B. Miao, M. Cao, J. S. Qian, L. F. Su, P. Chen, J. W. Liu, L. X. Wu, and T. Pang, Polym. Korea, 40, 524 (2016).
-

- 38. S. Biswas, B. Dutta, and S. Bhattacharya, RSC Adv., 5, 74486 (2015).
-

- 39. C. P. Li, J. Vongsvivut, X. D. She, Y. Z. Li, F. H. She, and L. X. Kong, Phys. Chem. Chem. Phys., 16, 22145 (2014).
-

- 40. M. C. Kuo, J. C. Huang, and M. Chen, Mater. Chem. Phys., 99, 258 (2006).
-

- 41. B. Yang, Y. Shi, G. J. Li, M. B. Yang, J. B. Miao, R. Xia, L. F. Su, J. S. Qian, P. Chen, and J. W. Liu, Plast. Rubber. Compos., 45, 398 (2016).
-

- 42. B. Yang and M. Y. Ding, J. Appl. Polym. Sci., 136, 17390 (2018).
-

- 43. B. Yang, J. B. Miao, K. Min, R. Xia, and J. S. Qian, J. Appl. Polym. Sci., 128, 1922 (2013).
-

- 44. S. P. Liang, B. Yang, X. R. Fu, and W. Yang, J. Appl. Polym. Sci., 117, 729 (2010).
-

- Polymer(Korea) 폴리머
- Frequency : Bimonthly(odd)
ISSN 0379-153X(Print)
ISSN 2234-8077(Online)
Abbr. Polym. Korea - 2023 Impact Factor : 0.4
- Indexed in SCIE
 This Article
-
2019; 43(5): 665-673
Published online Sep 25, 2019
- 10.7317/pk.2019.43.5.665
- Received on Mar 4, 2019
- Revised on Apr 21, 2019
- Accepted on Jul 2, 2019
 Services
- Full Text PDF
- Abstract
- ToC
- Acknowledgements
Introduction
Experimental
Results and Discussion
Conclusions
- References
Shared
 Correspondence to
- Bin Yang
-
College of Chemistry and Chemical Engineering, Key Laboratory of High-Performance Rubber and Products of Anhui Province, and Key Laboratory of Environment-Friendly Polymeric Materials of Anhui Province, Anhui University, Hefei 230601, China
- E-mail: yangbin@ahu.edu.cn
- ORCID:
0000-0001-7578-4389


 Copyright(c) The Polymer Society of Korea. All right reserved.